RSquare RSquare Adj Root Mean Square Error Mean of Response Observations (or Sum Wgts) 0.898583 0.894961 0.013343 0.171933 30
RSquare RSquare Adj Root Mean Square Error Mean of Response Observations (or Sum Wgts) 0.898583 0.894961 0.013343 0.171933 30

Functions and Change: A Modeling Approach to College Algebra (MindTap Course List)
6th Edition
ISBN:9781337111348
Author:Bruce Crauder, Benny Evans, Alan Noell
Publisher:Bruce Crauder, Benny Evans, Alan Noell
Chapter2: Graphical And Tabular Analysis
Section2.3: Solving Linear Equations
Problem 27E

Related questions
Question
Consider the years 2010–2012. Is there no correlation , a positive correlation , or a negative correlation ?
For the years 1984–2013, does the scatterplot show no correlation, a positive correlation, or a negative correlation?What can be said about the relationship between the year and the prevalence of adult smokers in California between the years 1984 and 2013?
Consider the years 1993–1998. What can be said of the correlation between the year and the prevalence of adult smokers?
Consider the years 2001–2006. What can be said of the correlation between the year and the prevalence of adult smokers?
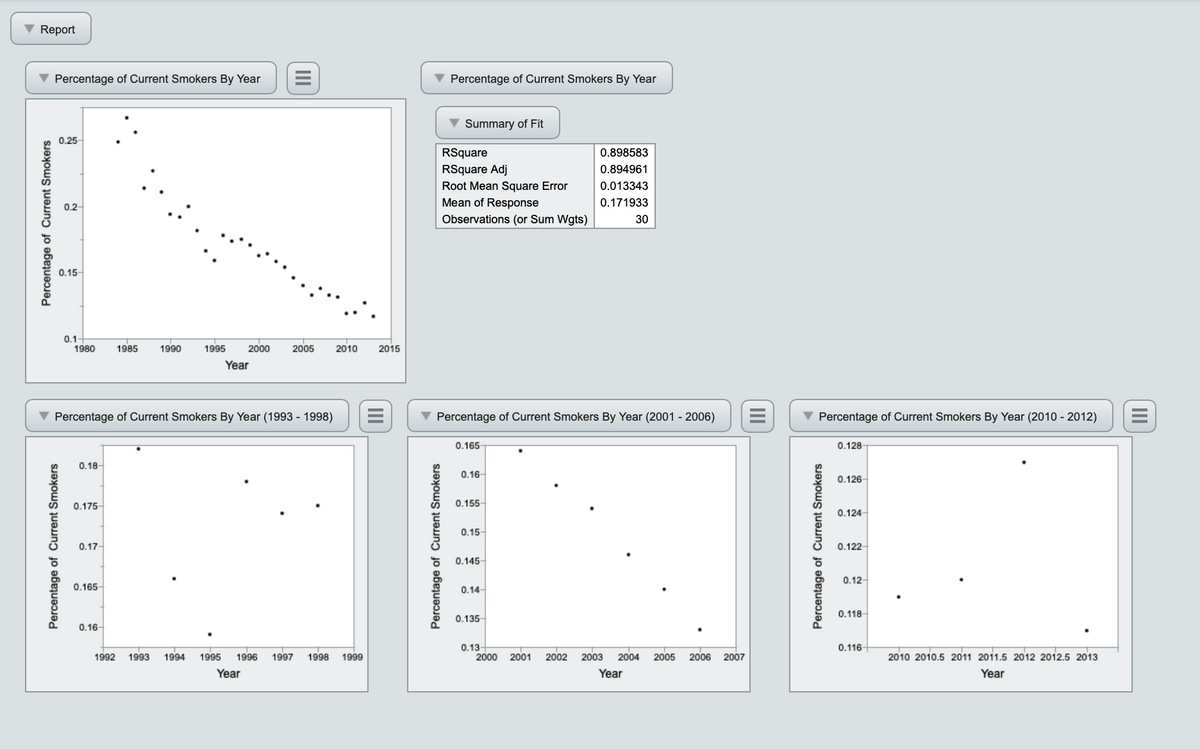
Transcribed Image Text:Report
Current Smokers
Percentage
Percentage of Current Smokers By Year
0.25-
0.2-
0.15-
Percentage of Current Smokers
0.1+
1980 1985
0.18-
0.175-
0.17-
0.165-
Percentage of Current Smokers By Year (1993 - 1998)
0.16-
1990
1992
1995
1993 1994 1995
2000
Year
|||
Year
2005 2010
1996 1997 1998 1999
2015
||||
Percentage of Current Smokers By Year
Percentage of Current Smokers
Summary of Fit
RSquare
RSquare Adj
Root Mean Square Error
Mean of Response
Observations (or Sum Wgts)
▼ Percentage of Current Smokers By Year (2001 - 2006)
0.165-
0.16-
0.155-
0.15-
0.145-
0.14-
0.135-
0.13-
0.898583
0.894961
0.013343
0.171933
30
2000 2001
2002 2003 2004 2005 2006
Year
2007
|||||
Percentage of Current Smokers By Year (2010-2012)
Percentage of Current Smokers
0.128
0.126
0.124
0.122-
0.12-
0.118-
0.116
2010 2010.5 2011 2011.5 2012 2012.5 2013
Year
|||
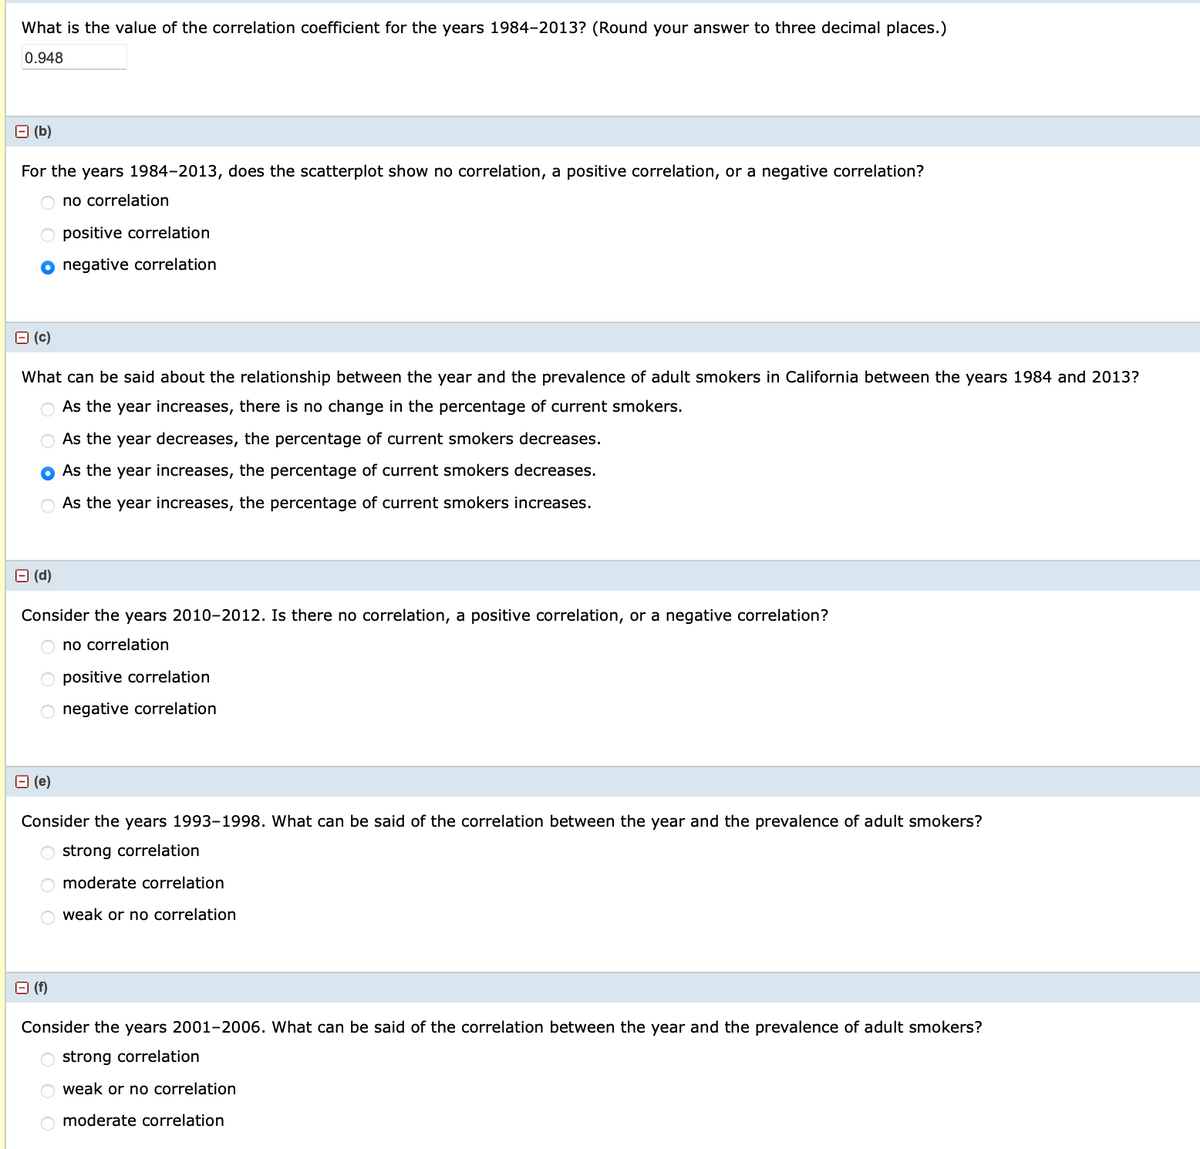
Transcribed Image Text:What is the value of the correlation coefficient for the years 1984-2013? (Round your answer to three decimal places.)
0.948
(b)
For the years 1984-2013, does the scatterplot show no correlation, a positive correlation, or a negative correlation?
Ono correlation
O positive correlation
O negative correlation
B (c)
What can be said about the relationship between the year and the prevalence of adult smokers in California between the years 1984 and 2013?
As the year increases, there is no change in the percentage of current smokers.
As the year decreases, the percentage of current smokers decreases.
As the year increases, the percentage of current smokers decreases.
As the year increases, the percentage of current smokers increases.
□ (d)
Consider the years 2010-2012. Is there no correlation, a positive correlation, or a negative correlation?
O no correlation
positive correlation
O negative correlation
(e)
Consider the years 1993-1998. What can be said of the correlation between the year and the prevalence of adult smokers?
O strong correlation
Omoderate correlation
Oweak or no correlation
(f)
Consider the years 2001-2006. What can be said of the correlation between the year and the prevalence of adult smokers?
O strong correlation
Oweak or no correlation
O moderate correlation
Expert Solution
This question has been solved!
Explore an expertly crafted, step-by-step solution for a thorough understanding of key concepts.

Step by step
Solved in 2 steps with 4 images

Recommended textbooks for you
Functions and Change: A Modeling Approach to Coll…
Algebra
ISBN:
9781337111348
Author:
Bruce Crauder, Benny Evans, Alan Noell
Publisher:
Cengage Learning

Big Ideas Math A Bridge To Success Algebra 1: Stu…
Algebra
ISBN:
9781680331141
Author:
HOUGHTON MIFFLIN HARCOURT
Publisher:
Houghton Mifflin Harcourt

Linear Algebra: A Modern Introduction
Algebra
ISBN:
9781285463247
Author:
David Poole
Publisher:
Cengage Learning
Functions and Change: A Modeling Approach to Coll…
Algebra
ISBN:
9781337111348
Author:
Bruce Crauder, Benny Evans, Alan Noell
Publisher:
Cengage Learning
Big Ideas Math A Bridge To Success Algebra 1: Stu…
Algebra
ISBN:
9781680331141
Author:
HOUGHTON MIFFLIN HARCOURT
Publisher:
Houghton Mifflin Harcourt
Linear Algebra: A Modern Introduction
Algebra
ISBN:
9781285463247
Author:
David Poole
Publisher:
Cengage Learning