1. If the blood pressure for a people has group of average of 90 and standard deviation 9, if we select 36 individual of that group, what is the probability that their blood pressure is larger than 86.
1. If the blood pressure for a people has group of average of 90 and standard deviation 9, if we select 36 individual of that group, what is the probability that their blood pressure is larger than 86.

Chapter8: Sequences, Series,and Probability
Section8.7: Probability
Problem 11ECP: A manufacturer has determined that a machine averages one faulty unit for every 500 it produces....

Related questions
Question
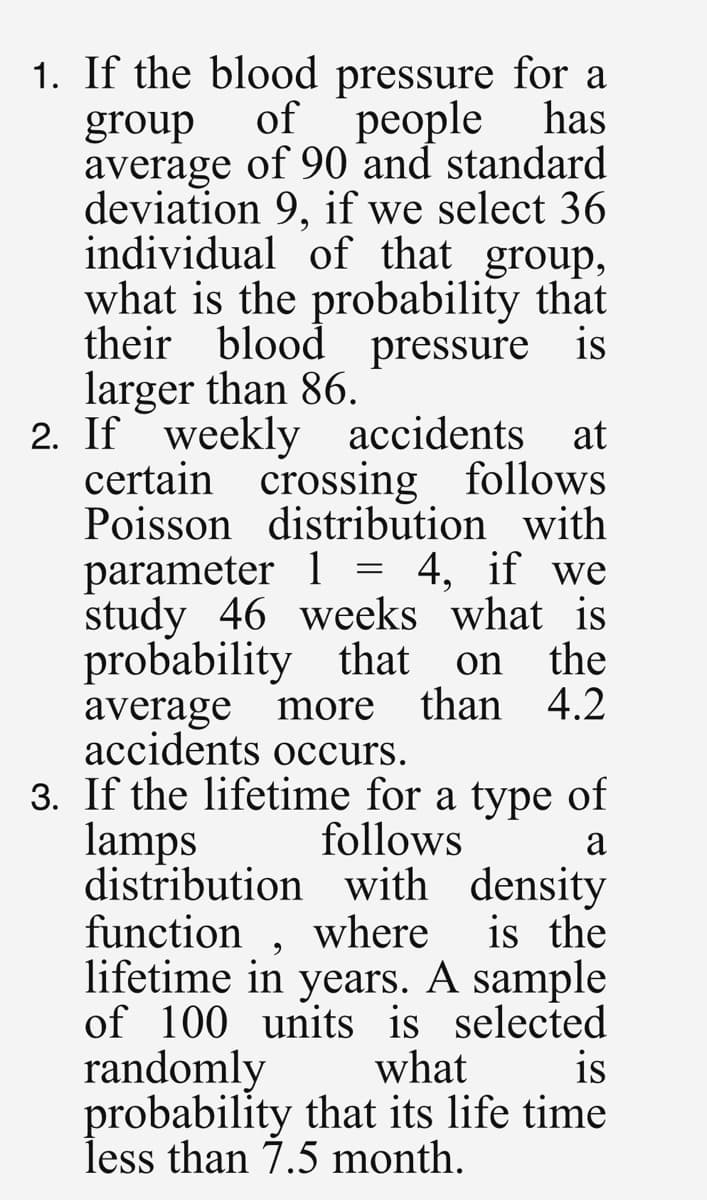
Transcribed Image Text:1. If the blood pressure for a
of people
has
group
average of 90 and standard
deviation 9, if we select 36
individual of that group,
what is the probability that
their blood pressure is
larger than 86.
2. If weekly accidents at
certain crossing follows
Poisson distribution with
parameter 1 = 4, if we
study 46 weeks what is
probability that on the
average more than 4.2
accidents occurs.
a
3. If the lifetime for a type of
lamps follows
distribution with density
function, where
lifetime in years. A sample
of 100 units is selected
randomly what
is the
is
probability that its life time
less than 7.5 month.
Expert Solution
This question has been solved!
Explore an expertly crafted, step-by-step solution for a thorough understanding of key concepts.

Step by step
Solved in 2 steps

Recommended textbooks for you