Run a regression analysis on the following bivariate set of data with y as the response variable. y 50.1 62.4 40.8 68.5 35.8 45.8 73 61.6 57.8 65.4 48.9 29.2 50.1 57.5 23.8 96.6 26.8 81.5 76.7 40.6 62.9 53.5 57.8 60.1 Find the correlation coefficient and report it accurate to three decimal places. What proportion of the variation in y can be explained by the variation in the values of x? Report answer as a percentage accurate to one decimal place. (if the answer is 0.84471, then it would be 84.5%..you woulo enter 84.5 without the percent symbol.) Based on the data, calculate the regression line (each value to three decimal places) y = Predict what value (on average) for the response variable will be obtained from a value of 35.8 as the explanatory variable. What is the predicted response value? (Report answer accurate to one decimal place.)
Run a regression analysis on the following bivariate set of data with y as the response variable. y 50.1 62.4 40.8 68.5 35.8 45.8 73 61.6 57.8 65.4 48.9 29.2 50.1 57.5 23.8 96.6 26.8 81.5 76.7 40.6 62.9 53.5 57.8 60.1 Find the correlation coefficient and report it accurate to three decimal places. What proportion of the variation in y can be explained by the variation in the values of x? Report answer as a percentage accurate to one decimal place. (if the answer is 0.84471, then it would be 84.5%..you woulo enter 84.5 without the percent symbol.) Based on the data, calculate the regression line (each value to three decimal places) y = Predict what value (on average) for the response variable will be obtained from a value of 35.8 as the explanatory variable. What is the predicted response value? (Report answer accurate to one decimal place.)

Chapter4: Linear Functions
Section: Chapter Questions
Problem 40RE: For the following exercises, consider the data in Table 5, which shows the percent of unemployed ina...

Related questions
Question
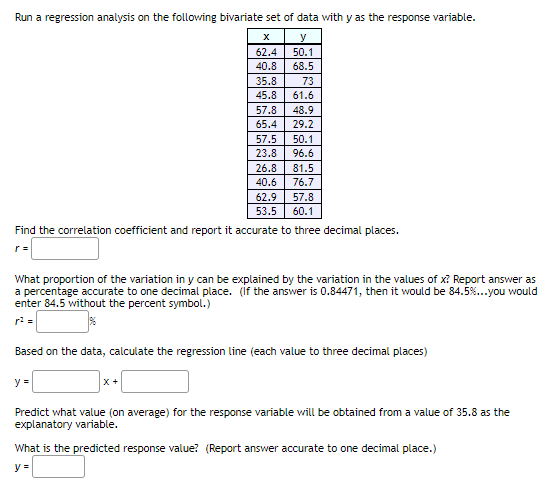
Transcribed Image Text:Run a regression analysis on the following bivariate set of data with y as the response variable.
y
62.4
50.1
40.8
68.5
35.8
73
45.8
61.6
57.8
48.9
65.4
29.2
57.5
50.1
23.8
96.6
26.8
81.5
40.6
76.7
62.9
57.8
53.5
60.1
Find the correlation coefficient and report it accurate to three decimal places.
r =
What proportion of the variation in y can be explained by the variation in the values of x? Report answer as
a percentage accurate to one decimal place. (if the answer is 0.84471, then it would be 84.5%...you would
enter 84.5 without the percent symbol.)
r: =
Based on the data, calculate the regression line (each value to three decimal places)
y =
X +
Predict what value (on average) for the response variable will be obtained from a value of 35.8 as the
explanatory variable.
What is the predicted response value? (Report answer accurate to one decimal place.)
y =
Expert Solution
This question has been solved!
Explore an expertly crafted, step-by-step solution for a thorough understanding of key concepts.

This is a popular solution!

Trending now
This is a popular solution!

Step by step
Solved in 3 steps with 2 images

Recommended textbooks for you

Glencoe Algebra 1, Student Edition, 9780079039897…
Algebra
ISBN:
9780079039897
Author:
Carter
Publisher:
McGraw Hill

Functions and Change: A Modeling Approach to Coll…
Algebra
ISBN:
9781337111348
Author:
Bruce Crauder, Benny Evans, Alan Noell
Publisher:
Cengage Learning
Glencoe Algebra 1, Student Edition, 9780079039897…
Algebra
ISBN:
9780079039897
Author:
Carter
Publisher:
McGraw Hill
Functions and Change: A Modeling Approach to Coll…
Algebra
ISBN:
9781337111348
Author:
Bruce Crauder, Benny Evans, Alan Noell
Publisher:
Cengage Learning