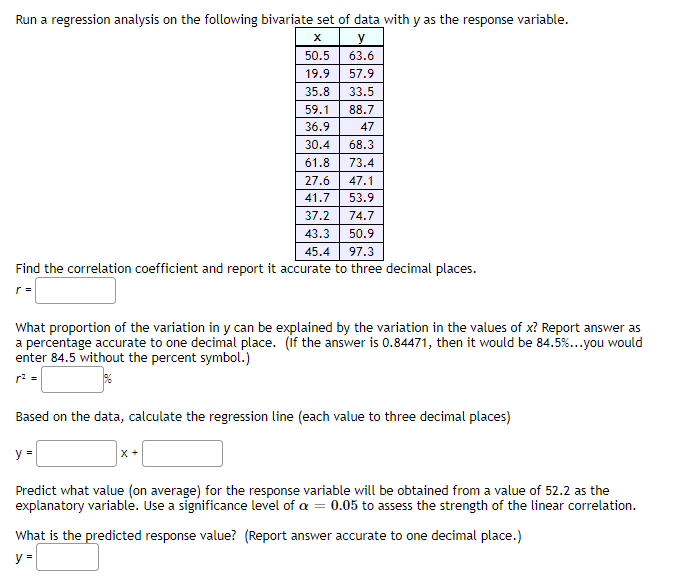
Run a regression analysis on the following bivariate set of data with y as the response variable. x y 50.5 63.6 19.9 57.9 35.8 33.5 59.1 88.7 36.9 47 30.4 68.3 61.8 73.4 27.6 47.1 41.7 53.9 37.2 74.7 43.3 50.9 45.4 97.3 Find the correlation coefficient and report it accurate to three decimal places. r = What proportion of the variation in y can be explained by the variation in the values of x? Report answer as a percentage accurate to one decimal place. (If the answer is 0.84471, then it would be 84.5%...you would enter 84.5 without the percent symbol.) r² = % Based on the data, calculate the regression line (each value to three decimal places) y = x +


Question 23: Run a
| x | y |
|---|---|
| 50.5 | 63.6 |
| 19.9 | 57.9 |
| 35.8 | 33.5 |
| 59.1 | 88.7 |
| 36.9 | 47 |
| 30.4 | 68.3 |
| 61.8 | 73.4 |
| 27.6 | 47.1 |
| 41.7 | 53.9 |
| 37.2 | 74.7 |
| 43.3 | 50.9 |
| 45.4 | 97.3 |
Find the
r =
What proportion of the variation in y can be explained by the variation in the values of x? Report answer as a percentage accurate to one decimal place. (If the answer is 0.84471, then it would be 84.5%...you would enter 84.5 without the percent symbol.)
r² = %
Based on the data, calculate the regression line (each value to three decimal places)
y = x +
Predict what value (on average) for the response variable will be obtained from a value of 52.2 as the explanatory variable. Use a significance level of α=0.05α=0.05 to assess the strength of the linear correlation.
What is the predicted response value? (Report answer accurate to one decimal place.)
y =


Trending now
This is a popular solution!

Step by step
Solved in 5 steps with 2 images


