S 3043 (Online) HW Module C DETAILS O O Temperature is used to measure the output of a production process. When the process is in control, the mean of the process is = 121.5 and the standard deviation is a = 0.3. (a) Compute the upper and lower control limits if samples of size 6 are to be used. (Round your answers to two decimal places.) UCL = LCL = Construct the x chart for this process. 122.50 + 122.25 122.00 121.75 121.50 121.25 121.00- 120.75 Sample Mean X webassign.net/web/Student/Assignment-Responses/submit?pos=4&dep=29026786&tags=autosave#question4759551_4 Sample Mean X + 122.50- 122.25 122.00 121.75 121.50 121.25 121.00 120.75 2 2 6 4 Sample Number 4 6 Sample Number 8 8 b) Consider a sample providing the following data. UCL LCL UCL LCL 10 10 Sample Mean X 122.50+ 122.25- 122.00- 121.75 121.50 121.25 121.00 120.75 2 + 4 6 Sample Number 8 UCL LCL MY NOTES 10 ASK YOUR TEACHER 122.50 122.25 122.00 121.75 121.50 121.25 121.00 120.75 2 4 6 Sample Number * 0 K Update PRACTICE ANOTHER UCL 8 LCL 10
S 3043 (Online) HW Module C DETAILS O O Temperature is used to measure the output of a production process. When the process is in control, the mean of the process is = 121.5 and the standard deviation is a = 0.3. (a) Compute the upper and lower control limits if samples of size 6 are to be used. (Round your answers to two decimal places.) UCL = LCL = Construct the x chart for this process. 122.50 + 122.25 122.00 121.75 121.50 121.25 121.00- 120.75 Sample Mean X webassign.net/web/Student/Assignment-Responses/submit?pos=4&dep=29026786&tags=autosave#question4759551_4 Sample Mean X + 122.50- 122.25 122.00 121.75 121.50 121.25 121.00 120.75 2 2 6 4 Sample Number 4 6 Sample Number 8 8 b) Consider a sample providing the following data. UCL LCL UCL LCL 10 10 Sample Mean X 122.50+ 122.25- 122.00- 121.75 121.50 121.25 121.00 120.75 2 + 4 6 Sample Number 8 UCL LCL MY NOTES 10 ASK YOUR TEACHER 122.50 122.25 122.00 121.75 121.50 121.25 121.00 120.75 2 4 6 Sample Number * 0 K Update PRACTICE ANOTHER UCL 8 LCL 10

Algebra & Trigonometry with Analytic Geometry
13th Edition
ISBN:9781133382119
Author:Swokowski
Publisher:Swokowski
Chapter10: Sequences, Series, And Probability
Section10.2: Arithmetic Sequences
Problem 68E

Related questions
Question
Transcribed Image Text:←
1.
MS 3043(Online) HW Module X +
с
DETAILS
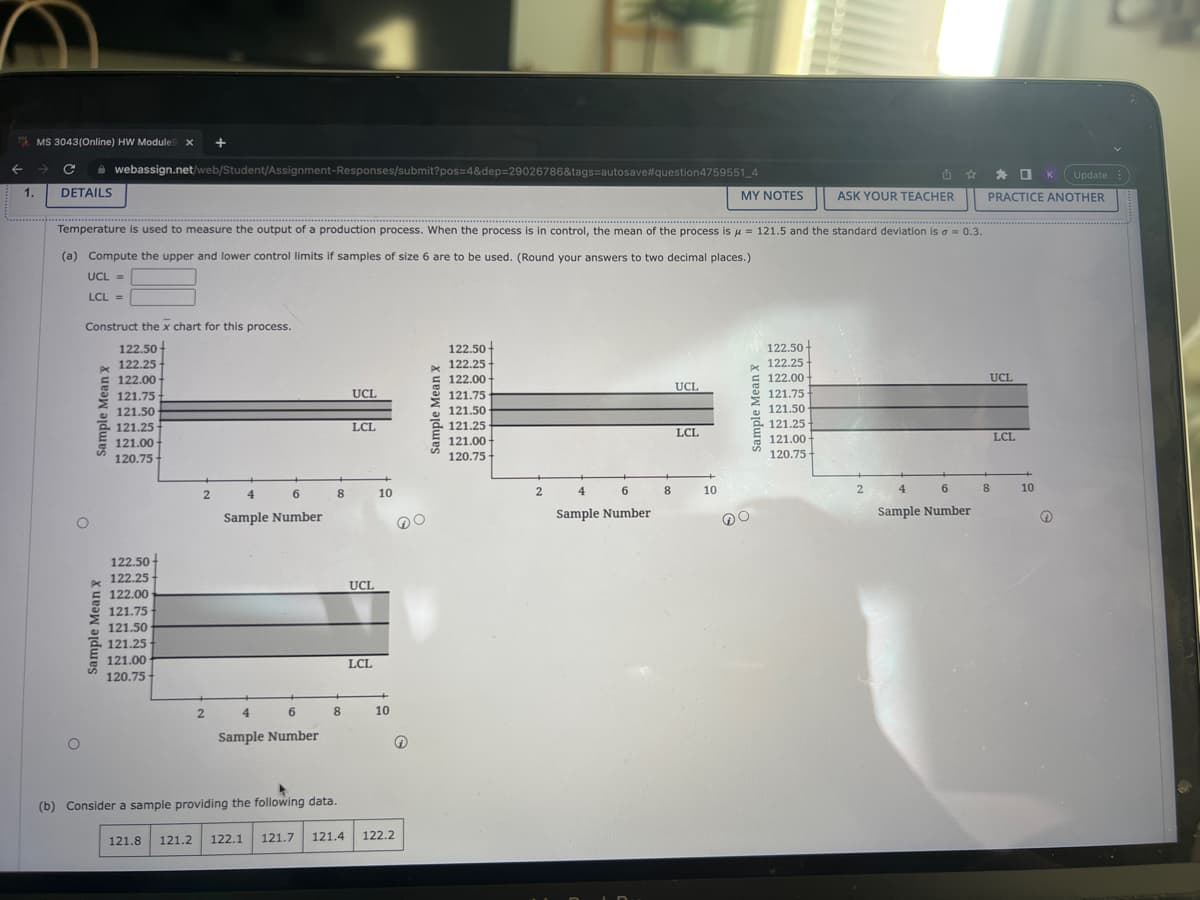
Construct the x chart for this process.
122.50-
122.25-
122.00-
121.75
121.50
121.25
121.00
120.75
O
webassign.net/web/Student/Assignment-Responses/submit?pos=4&dep=29026786&tags=autosave#question4759551_4
o
Temperature is used to measure the output of a production process. When the process is in control, the mean of the process is μ = 121.5 and the standard deviation is = 0.3.
(a) Compute the upper and lower control limits if samples of size 6 are to be used. (Round your answers to two decimal places.)
UCL =
LCL =
Sample Mean X
Sample Mean X
122.50-
122.25
122.00
121.75
121.50
121.25
121.00
120.75
2
121.8 121.2
2
4
6
Sample Number
4
6
Sample Number
8
8
(b) Consider a sample providing the following data.
122.1 121.7 121.4
UCL
LCL
UCL
LCL
10
+
10
122.2
Sample Mean X
122.50
122.25-
122.00+
121.75
121.50
121.25
121.00
120.75-
2
4
6
Sample Number
8
UCL
LCL
MY NOTES
10
Sample Mean X
ASK YOUR TEACHER
122.50-
122.25
122.00
121.75
121.50
121.25-
121.00-
120.75
2
4
6
Sample Number
* 0 ☐K Update
PRACTICE ANOTHER
UCL
8
LCL
10
Ⓡ
Transcribed Image Text:←
MS 3043(Online) HW Module! X +
с webassign.net/web/Student/Assignment-Responses/submit?pos=4&dep=29026786&tags=autosave#question4759551_4
O
2
6
4
Sample Number
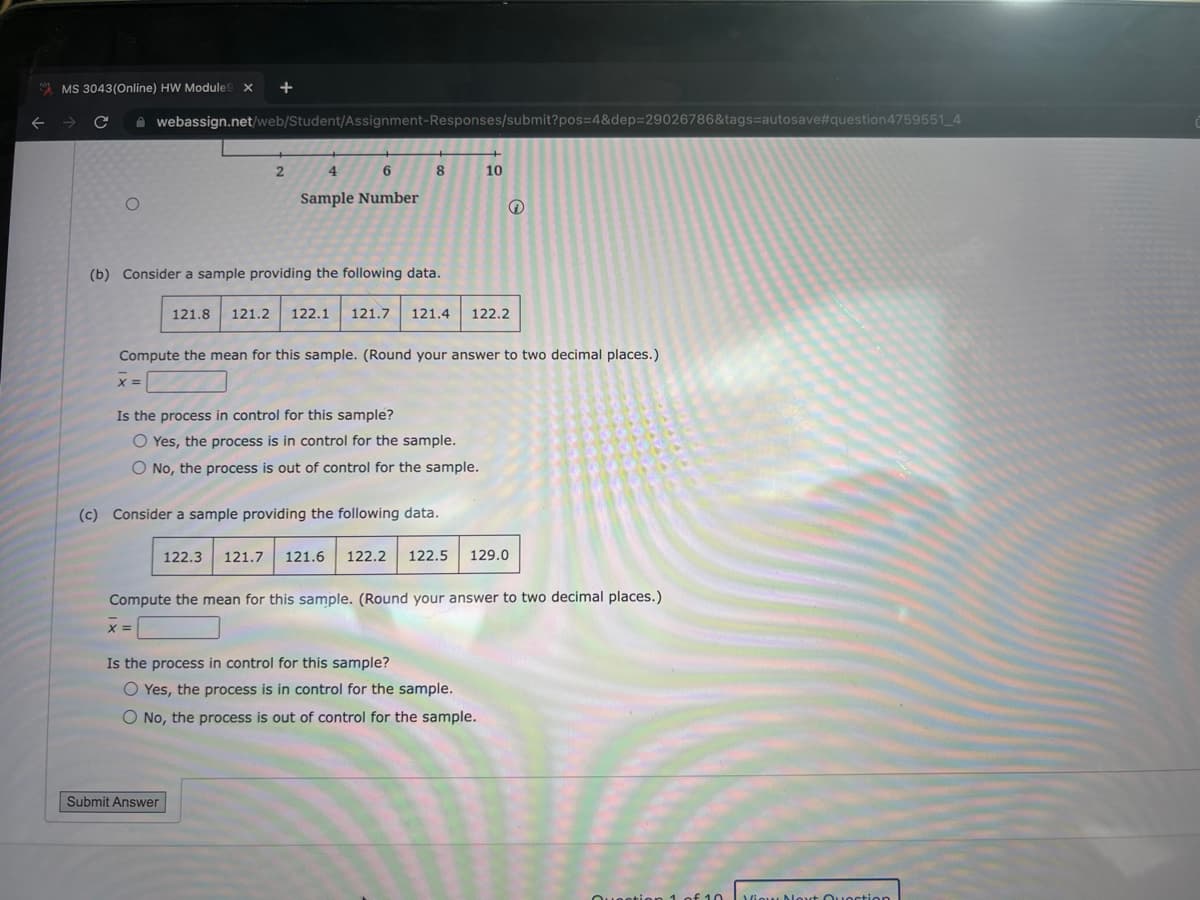
(b) Consider a sample providing the following data.
8
x =
Compute the mean for this sample. (Round your answer to two decimal places.)
Is the process in control for this sample?
O Yes, the process is in control for the sample.
O No, the process is out of control for the sample.
121.8 121.2 122.1 121.7 121.4 122.2
(c) Consider a sample providing the following data.
Submit Answer
10
Compute the mean for this sample. (Round your answer to two decimal places.)
122.3 121.7 121.6 122.2 122.5 129.0
Is the process in control for this sample?
O Yes, the process is in control for the sample.
O No, the process is out of control for the sample.
iou Nout Question
Expert Solution
This question has been solved!
Explore an expertly crafted, step-by-step solution for a thorough understanding of key concepts.

Step by step
Solved in 3 steps with 3 images

Recommended textbooks for you
Algebra & Trigonometry with Analytic Geometry
Algebra
ISBN:
9781133382119
Author:
Swokowski
Publisher:
Cengage
Algebra & Trigonometry with Analytic Geometry
Algebra
ISBN:
9781133382119
Author:
Swokowski
Publisher:
Cengage