Sam scored a 27 on his ACT last back in October. The mean ACT score for his class was 23, with a standard deviation of 2. Assuming a normal (bell- shaped) distribution for students' scores, answer the following: 1) What percentage of students would you expect to have scored higher than Sam? 34 74 330 25/14 2) What percentage of students should have scored between Sam's score -30 13.3 and the mean? 44. 5 2 5% 3) Jessica scored a 21 on the ACT? What percentage of students would you expect to have scored lower than Jessica? 50.0 (34.0)
Sam scored a 27 on his ACT last back in October. The mean ACT score for his class was 23, with a standard deviation of 2. Assuming a normal (bell- shaped) distribution for students' scores, answer the following: 1) What percentage of students would you expect to have scored higher than Sam? 34 74 330 25/14 2) What percentage of students should have scored between Sam's score -30 13.3 and the mean? 44. 5 2 5% 3) Jessica scored a 21 on the ACT? What percentage of students would you expect to have scored lower than Jessica? 50.0 (34.0)

MATLAB: An Introduction with Applications
6th Edition
ISBN:9781119256830
Author:Amos Gilat
Publisher:Amos Gilat
Chapter1: Starting With Matlab
Section: Chapter Questions
Problem 1P

Related questions
Question
Transcribed Image Text:2 pu/21
Prersa
Stats RM Proble1
Setil
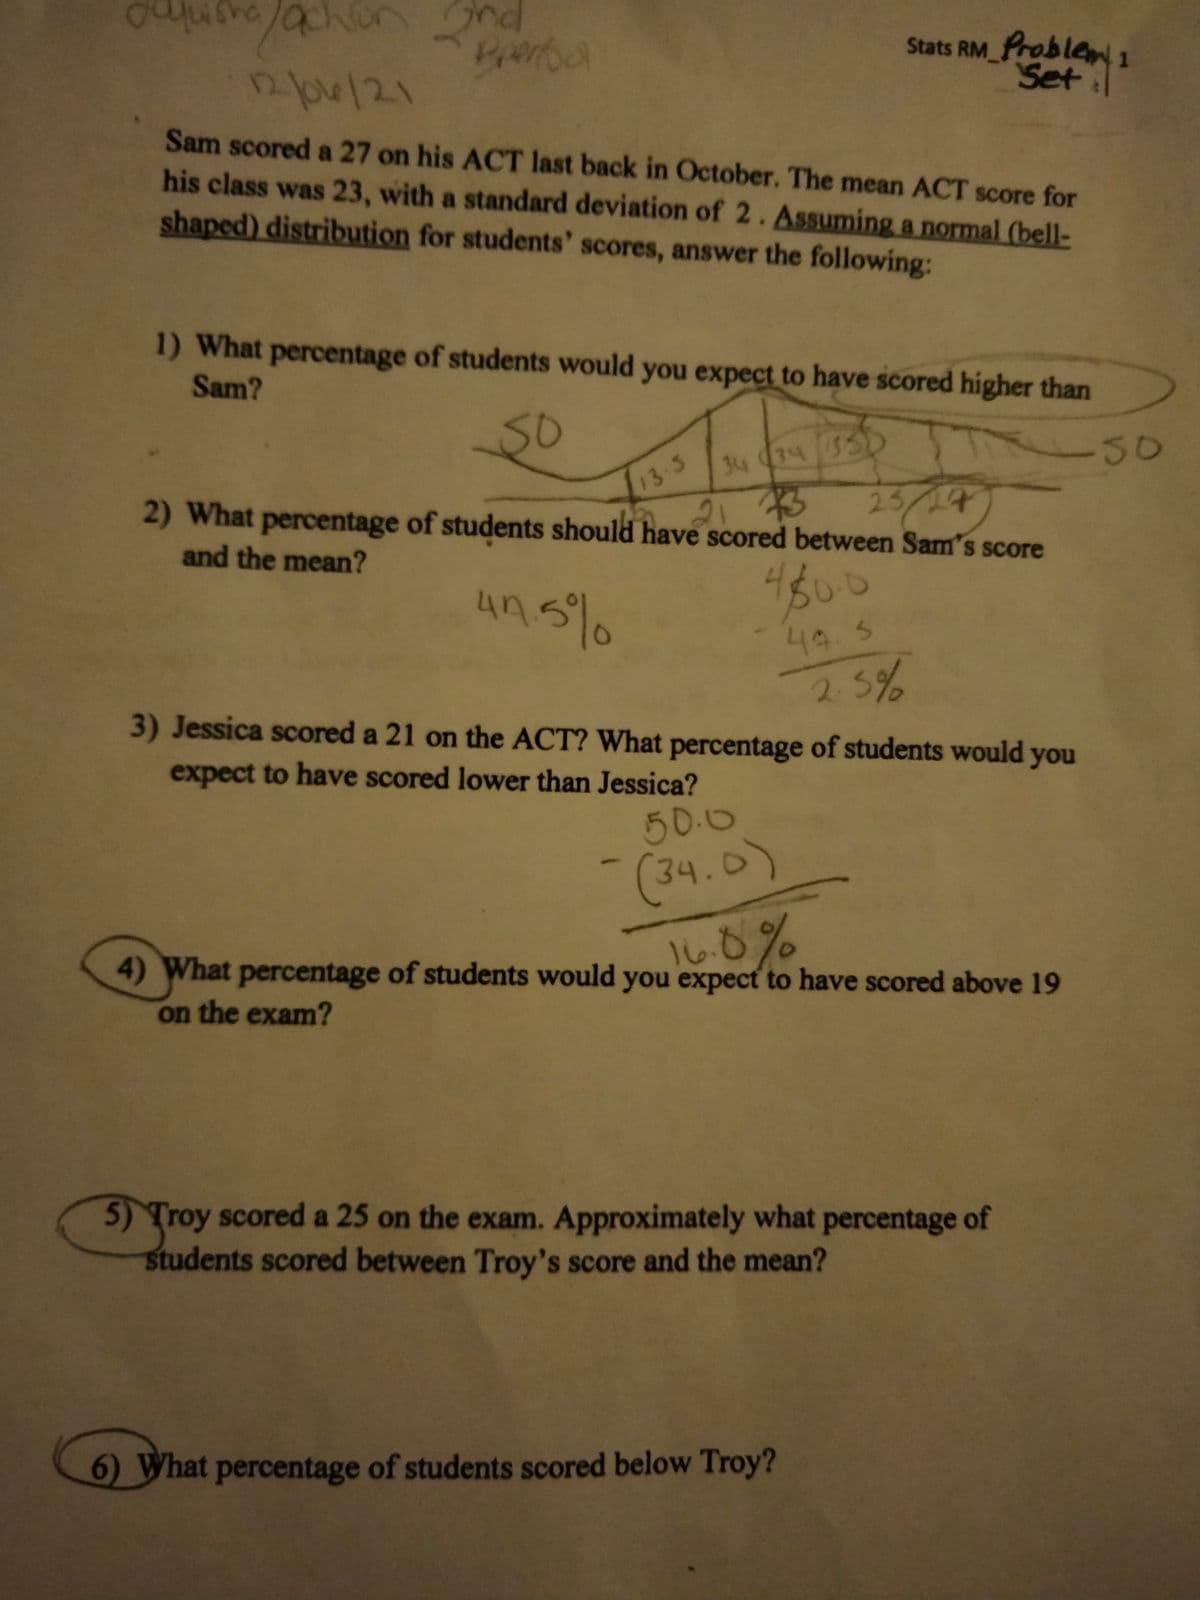
Sam scored a 27 on his ACT last back in October. The mean ACT score for
his class was 23, with a standard deviation of 2. Assuming a normal (bell-
shaped) distribution for students' scores, answer the following:
1) What percentage of students would you expect to have scored higher than
Sam?
-30
13-3
21 73
34 34 350
25/24
2) What percentage of students should have scored between Sam's score
and the mean?
4800
44. 5
2 5%
4n.
3) Jessica scored a 21 on the ACT? What percentage of students would you
expect to have scored lower than Jessica?
50.0
(34.0)
16.0%
4) What percentage of students would you expect to have scored above 19
on the exam?
5) Troy scored a 25 on the exam. Approximately what percentage of
students scored between Troy's score and the mean?
6) What percentage of students scored below Troy?
Expert Solution
This question has been solved!
Explore an expertly crafted, step-by-step solution for a thorough understanding of key concepts.

This is a popular solution!

Trending now
This is a popular solution!

Step by step
Solved in 2 steps with 2 images

Recommended textbooks for you
MATLAB: An Introduction with Applications
Statistics
ISBN:
9781119256830
Author:
Amos Gilat
Publisher:
John Wiley & Sons Inc

Probability and Statistics for Engineering and th…
Statistics
ISBN:
9781305251809
Author:
Jay L. Devore
Publisher:
Cengage Learning

Statistics for The Behavioral Sciences (MindTap C…
Statistics
ISBN:
9781305504912
Author:
Frederick J Gravetter, Larry B. Wallnau
Publisher:
Cengage Learning
MATLAB: An Introduction with Applications
Statistics
ISBN:
9781119256830
Author:
Amos Gilat
Publisher:
John Wiley & Sons Inc
Probability and Statistics for Engineering and th…
Statistics
ISBN:
9781305251809
Author:
Jay L. Devore
Publisher:
Cengage Learning
Statistics for The Behavioral Sciences (MindTap C…
Statistics
ISBN:
9781305504912
Author:
Frederick J Gravetter, Larry B. Wallnau
Publisher:
Cengage Learning

Elementary Statistics: Picturing the World (7th E…
Statistics
ISBN:
9780134683416
Author:
Ron Larson, Betsy Farber
Publisher:
PEARSON

The Basic Practice of Statistics
Statistics
ISBN:
9781319042578
Author:
David S. Moore, William I. Notz, Michael A. Fligner
Publisher:
W. H. Freeman

Introduction to the Practice of Statistics
Statistics
ISBN:
9781319013387
Author:
David S. Moore, George P. McCabe, Bruce A. Craig
Publisher:
W. H. Freeman