Sample AP Graphing Exercise A steel sphere is dropped from rest and the distance of the fall is given by the equation gt². D is the distance fallen and is the time of the fall. The acceleration due to gravity is the constant known as g. Below is a table showing information on the first two meters of the sphere's descent. Distance of Fall (m) Time of Fall (s) Distance (m) 2.5 2.0 1.5 1.0 0.5 0.10 0.14 0 0.50 0.32 0.2 1.00 0.46 1.70 0.59 2.00 0.63 0.5 0.1 0.3 0.4 a) Draw a line of best fit for the distance vs. time graph above. Steel Sphere Recording Plate 0.6 1 0.7 Time (s) b) If only the variables D and t are used, what quantities should the student graph in order to produce a linear relationship between the two quantities? c) On the grid below, plot the data points for the quantities you have identified in part (b), and sketch the straight-line fit to the points. Label your axes and show the scale that you have chosen for the graph.
Sample AP Graphing Exercise A steel sphere is dropped from rest and the distance of the fall is given by the equation gt². D is the distance fallen and is the time of the fall. The acceleration due to gravity is the constant known as g. Below is a table showing information on the first two meters of the sphere's descent. Distance of Fall (m) Time of Fall (s) Distance (m) 2.5 2.0 1.5 1.0 0.5 0.10 0.14 0 0.50 0.32 0.2 1.00 0.46 1.70 0.59 2.00 0.63 0.5 0.1 0.3 0.4 a) Draw a line of best fit for the distance vs. time graph above. Steel Sphere Recording Plate 0.6 1 0.7 Time (s) b) If only the variables D and t are used, what quantities should the student graph in order to produce a linear relationship between the two quantities? c) On the grid below, plot the data points for the quantities you have identified in part (b), and sketch the straight-line fit to the points. Label your axes and show the scale that you have chosen for the graph.

Glencoe Physics: Principles and Problems, Student Edition
1st Edition
ISBN:9780078807213
Author:Paul W. Zitzewitz
Publisher:Paul W. Zitzewitz
Chapter4: Forces In One Dimension
Section: Chapter Questions
Problem 80A

Related questions

Question
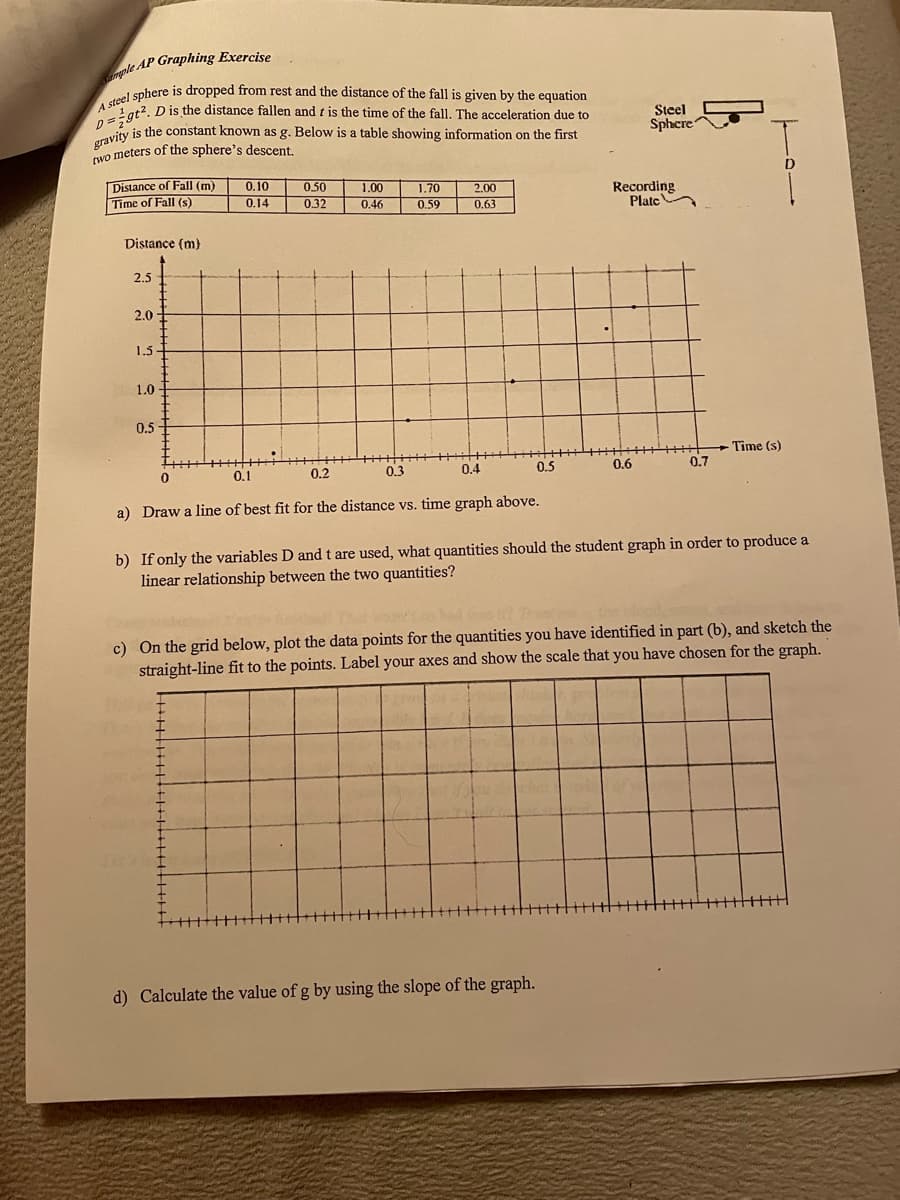
Transcribed Image Text:Sample AP Graphing Exercise
A steel sphere is dropped from rest and the distance of the fall is given by the equation
D=;gt. D is the distance fallen and t is the time of the fall. The acceleration due to
gravity is the constant known as g. Below is a table showing information on the first
two meters of the sphere's descent.
Distance of Fall (m)
Time of Fall (s)
Distance (m)
2.5
2.0
1.5
1.0
0.5
0.10
0.14
0
0.1
0.50
0.32
1.00
0.46
0.3
1.70
0.59
2.00
0.63
0.2
0.4
a) Draw a line of best fit for the distance vs. time graph above.
0.5
d) Calculate the value of g by using the slope of the graph.
Steel
Sphere
Recording
Plate
0.6
0.7
- Time (s)
D
b) If only the variables D and t are used, what quantities should the student graph in order to produce a
linear relationship between the two quantities?
c) On the grid below, plot the data points for the quantities you have identified in part (b), and sketch the
straight-line fit to the points. Label your axes and show the scale that you have chosen for the graph.
Expert Solution
This question has been solved!
Explore an expertly crafted, step-by-step solution for a thorough understanding of key concepts.

This is a popular solution!

Trending now
This is a popular solution!

Step by step
Solved in 2 steps with 2 images

Knowledge Booster


Learn more about
Need a deep-dive on the concept behind this application? Look no further. Learn more about this topic, physics and related others by exploring similar questions and additional content below.Recommended textbooks for you
Glencoe Physics: Principles and Problems, Student…
Physics
ISBN:
9780078807213
Author:
Paul W. Zitzewitz
Publisher:
Glencoe/McGraw-Hill
Glencoe Physics: Principles and Problems, Student…
Physics
ISBN:
9780078807213
Author:
Paul W. Zitzewitz
Publisher:
Glencoe/McGraw-Hill