Sample Data: 70, 75, 75, 80, 80, 96, 100 a. Mean: b. Median: c. Mode:

Glencoe Algebra 1, Student Edition, 9780079039897, 0079039898, 2018
18th Edition
ISBN:9780079039897
Author:Carter
Publisher:Carter
Chapter10: Statistics
Section10.5: Comparing Sets Of Data
Problem 13PPS

Related questions
Question
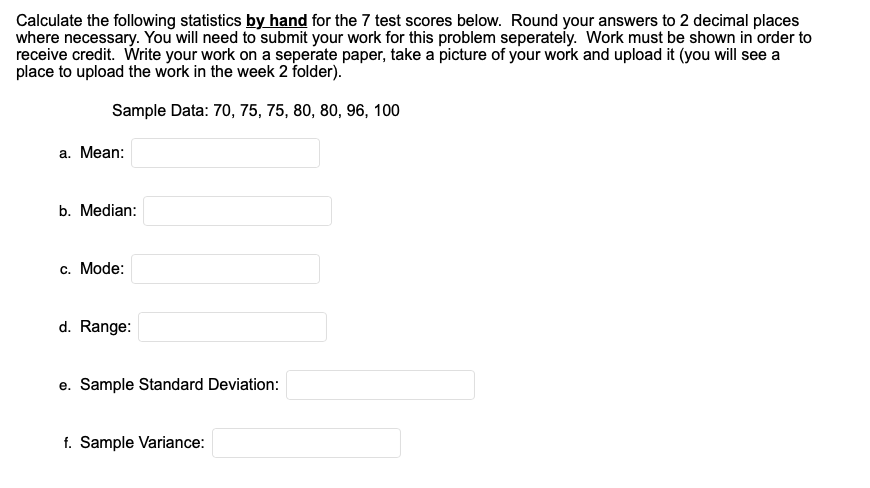
Transcribed Image Text:Calculate the following statistics by hand for the 7 test scores below. Round your answers to 2 decimal places
where necessary. You will need to submit your work for this problem seperately. Work must be shown in order to
receive credit. Write your work on a seperate paper, take a picture of your work and upload it (you will see a
place to upload the work in the week 2 folder).
Sample Data: 70, 75, 75, 80, 80, 96, 100
a. Mean:
b. Median:
c. Mode:
d. Range:
e. Sample Standard Deviation:
f. Sample Variance:
Expert Solution
This question has been solved!
Explore an expertly crafted, step-by-step solution for a thorough understanding of key concepts.

Step by step
Solved in 3 steps with 2 images

Recommended textbooks for you
Glencoe Algebra 1, Student Edition, 9780079039897…
Algebra
ISBN:
9780079039897
Author:
Carter
Publisher:
McGraw Hill
Glencoe Algebra 1, Student Edition, 9780079039897…
Algebra
ISBN:
9780079039897
Author:
Carter
Publisher:
McGraw Hill