5. Circle one answer in each row for "Type of Variable" and "Level of Measurement". Variable Type of Variable Level of Measurement Categorical (qualitative) Discrete Continuous Zip Code How many coffee cups are in Categorical (qualitative) a cupboard Discrete Continuous Nominal Interval Nominal Interval Ordinal Ratio Ordinal Ratio
5. Circle one answer in each row for "Type of Variable" and "Level of Measurement". Variable Type of Variable Level of Measurement Categorical (qualitative) Discrete Continuous Zip Code How many coffee cups are in Categorical (qualitative) a cupboard Discrete Continuous Nominal Interval Nominal Interval Ordinal Ratio Ordinal Ratio

Glencoe Algebra 1, Student Edition, 9780079039897, 0079039898, 2018
18th Edition
ISBN:9780079039897
Author:Carter
Publisher:Carter
Chapter10: Statistics
Section10.3: Measures Of Spread
Problem 1GP

Related questions
Question
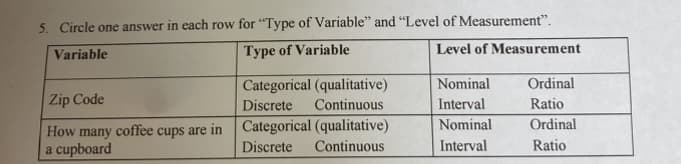
Transcribed Image Text:5. Circle one answer in each row for "Type of Variable" and "Level of Measurement".
Variable
Type of Variable
Level of Measurement
Categorical (qualitative)
Discrete Continuous
Zip Code
How many coffee cups are in Categorical (qualitative)
a cupboard
Discrete Continuous
Nominal
Interval
Nominal
Interval
Ordinal
Ratio
Ordinal
Ratio
Expert Solution
This question has been solved!
Explore an expertly crafted, step-by-step solution for a thorough understanding of key concepts.

Step by step
Solved in 2 steps with 2 images

Recommended textbooks for you
Glencoe Algebra 1, Student Edition, 9780079039897…
Algebra
ISBN:
9780079039897
Author:
Carter
Publisher:
McGraw Hill

Holt Mcdougal Larson Pre-algebra: Student Edition…
Algebra
ISBN:
9780547587776
Author:
HOLT MCDOUGAL
Publisher:
HOLT MCDOUGAL
Glencoe Algebra 1, Student Edition, 9780079039897…
Algebra
ISBN:
9780079039897
Author:
Carter
Publisher:
McGraw Hill
Holt Mcdougal Larson Pre-algebra: Student Edition…
Algebra
ISBN:
9780547587776
Author:
HOLT MCDOUGAL
Publisher:
HOLT MCDOUGAL