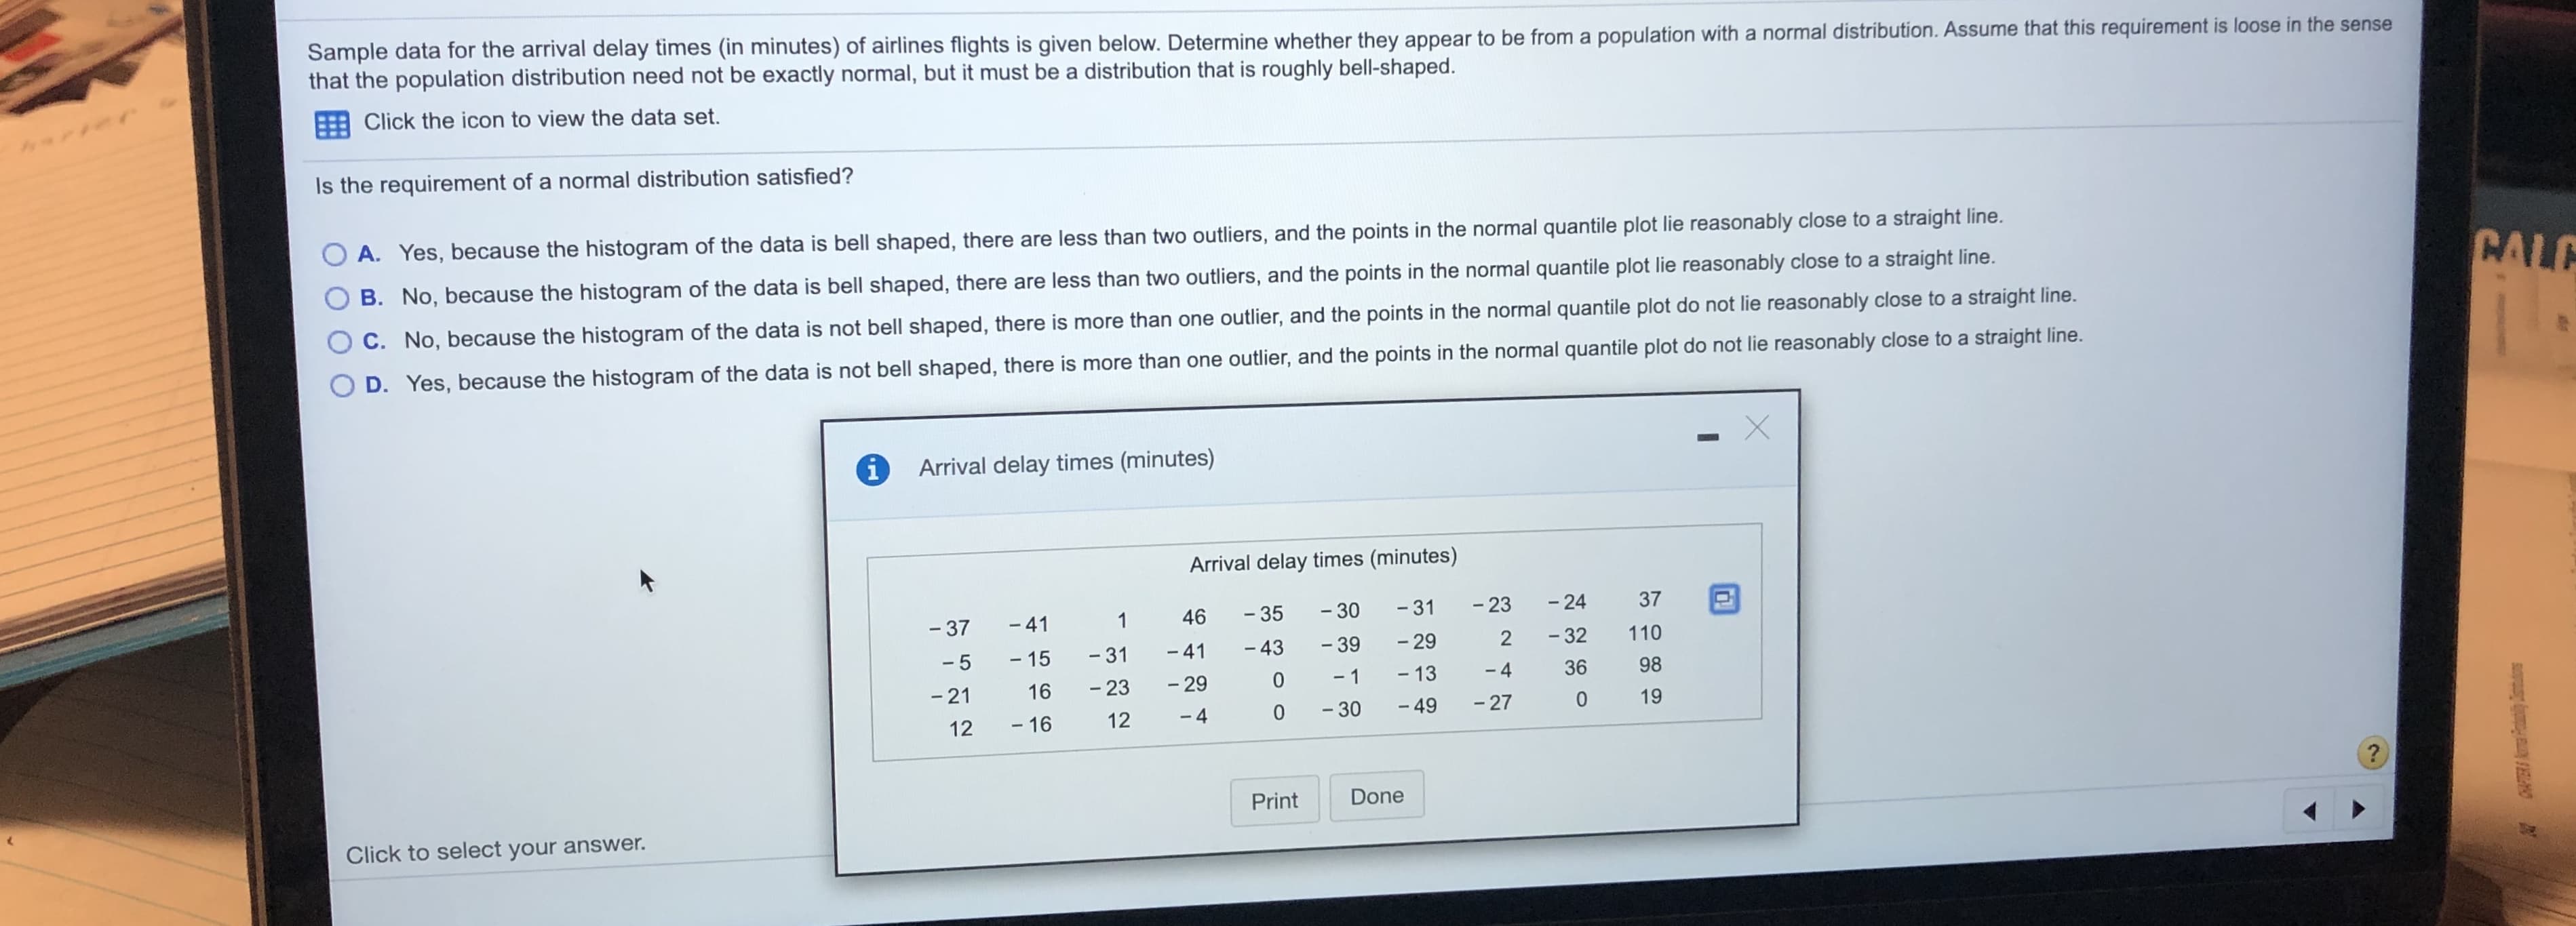
Sample data for the arrival delay times (in minutes) of airlines flights is given below. Determine whether they appear to be from a population with a normal distribution. Assume that this requirement is loose in the sense that the population distribution need not be exactly normal, but it must be a distribution that is roughly bell-shaped. Click the icon to view the data set. Is the requirement of a normal distribution satisfied? A. Yes, because the histogram of the data is bell shaped, there are less than two outliers, and the points in the normal quantile plot lie reasonably close to a straight line. B. No, because the histogram of the data is bell shaped, there are less than two outliers, and the points in the normal quantile plot lie reasonably close to a straight line. CALC C. No, because the histogram of the data is not bell shaped, there is more than one outlier, and the points in the normal quantile plot do not lie reasonably close to a straight line. O D. Yes, because the histogram of the data is not bell shaped, there is more than one outlier, and the points in the normal quantile plot do not lie reasonably close to a straight line. Arrival delay times (minutes) Arrival delay times (minutes) - 37 - 41 46 - 35 - 30 - 31 - 23 - 24 37 - 41 - 29 - 4 - 15 - 32 110 - 5 - 21 - 31 - 43 - 39 - 29 - 13 - 4 36 98 16 - 23 - 30 - 49 - 27 19 12 - 16 12 Print Done Click to select your answer. MCHAPTERS oma PotailyAs


Addition Rule of Probability
It simply refers to the likelihood of an event taking place whenever the occurrence of an event is uncertain. The probability of a single event can be calculated by dividing the number of successful trials of that event by the total number of trials.
Expected Value
When a large number of trials are performed for any random variable ‘X’, the predicted result is most likely the mean of all the outcomes for the random variable and it is known as expected value also known as expectation. The expected value, also known as the expectation, is denoted by: E(X).
Probability Distributions
Understanding probability is necessary to know the probability distributions. In statistics, probability is how the uncertainty of an event is measured. This event can be anything. The most common examples include tossing a coin, rolling a die, or choosing a card. Each of these events has multiple possibilities. Every such possibility is measured with the help of probability. To be more precise, the probability is used for calculating the occurrence of events that may or may not happen. Probability does not give sure results. Unless the probability of any event is 1, the different outcomes may or may not happen in real life, regardless of how less or how more their probability is.
Basic Probability
The simple definition of probability it is a chance of the occurrence of an event. It is defined in numerical form and the probability value is between 0 to 1. The probability value 0 indicates that there is no chance of that event occurring and the probability value 1 indicates that the event will occur. Sum of the probability value must be 1. The probability value is never a negative number. If it happens, then recheck the calculation.
Can you assist me in answering this, please?
(not graded, solely for acquisition)


Trending now
This is a popular solution!

Step by step
Solved in 3 steps with 2 images


