Sample mean Sample standard deviation | | Number of children | Free time (in hours) 12.45 7.12 2.27 1.42 The correlation between the variables is equal to -0.83. (a) --Select- (b) Will the correlation change if we measure the free time in minutes instead of hours? -Select-- (c) Compute the regression line for predicting the amount of free time (in hours) parents have in a given week. v is the explanatory variable and -Select--- is the response variable from the point of view of researchers. Free time - * Number of children +
Sample mean Sample standard deviation | | Number of children | Free time (in hours) 12.45 7.12 2.27 1.42 The correlation between the variables is equal to -0.83. (a) --Select- (b) Will the correlation change if we measure the free time in minutes instead of hours? -Select-- (c) Compute the regression line for predicting the amount of free time (in hours) parents have in a given week. v is the explanatory variable and -Select--- is the response variable from the point of view of researchers. Free time - * Number of children +

MATLAB: An Introduction with Applications
6th Edition
ISBN:9781119256830
Author:Amos Gilat
Publisher:Amos Gilat
Chapter1: Starting With Matlab
Section: Chapter Questions
Problem 1P

Related questions
Topic Video
Question
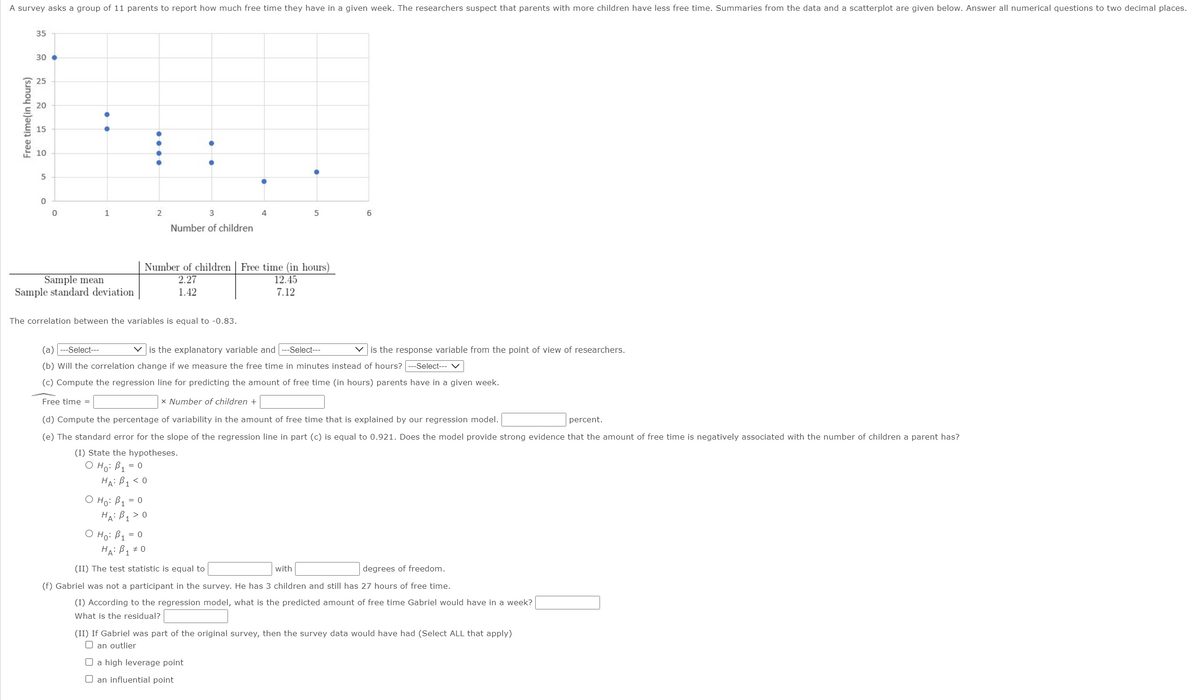
Transcribed Image Text:A survey asks a group of 11 parents to report how much free time they have in a given week. The researchers suspect that parents with more children have less free time. Summaries from the data and a scatterplot are given below. Answer all numerical questions to two decimal places.
35
30
25
20
15
10
5
1
2
3
4
Number of children
Free time (in hours)
12.45
Number of children
2.27
Sample mean
Sample standard deviation
1.42
7.12
The correlation between the variables is equal to -0.83.
(a) ---Select---
is the explanatory variable and --Select---
V is the response variable from the point of view of researchers.
(b) Will the correlation change if we measure the free time in minutes instead of hours? ---Select-- V
(c) Compute the regression line for predicting the amount of free time (in hours) parents have in a given week.
Free time =
x Number of children +
(d) Compute the percentage of variability in the amount of free time that is explained by our regression model.
percent.
(e) The standard error for the slope of the regression line in part (c) is equal to 0.921. Does the model provide strong evidence that the amount of free time is negatively associated with the number of children a parent has?
(I) State the hypotheses.
O Ho: B1 = 0
HA: B1<0
O Ho: B1 = 0
HA: B1 > 0
O Ho: B1
HA: Bq #0
= 0
(II) The test statistic is equal to
with
degrees of freedom.
(f) Gabriel was not a participant in the survey. He has 3 children and still has 27 hours of free time.
(I) According to the regression model, what is the predicted amount of free time Gabriel would have in a week?
What is the residual?
(II) If Gabriel was part of the original survey, then the survey data would have had (Select ALL that apply)
O an outlier
O a high leverage point
O an influential point
Free time(in hours)
Expert Solution
This question has been solved!
Explore an expertly crafted, step-by-step solution for a thorough understanding of key concepts.

Step by step
Solved in 3 steps with 8 images

Knowledge Booster


Learn more about
Need a deep-dive on the concept behind this application? Look no further. Learn more about this topic, statistics and related others by exploring similar questions and additional content below.Recommended textbooks for you
MATLAB: An Introduction with Applications
Statistics
ISBN:
9781119256830
Author:
Amos Gilat
Publisher:
John Wiley & Sons Inc

Probability and Statistics for Engineering and th…
Statistics
ISBN:
9781305251809
Author:
Jay L. Devore
Publisher:
Cengage Learning

Statistics for The Behavioral Sciences (MindTap C…
Statistics
ISBN:
9781305504912
Author:
Frederick J Gravetter, Larry B. Wallnau
Publisher:
Cengage Learning
MATLAB: An Introduction with Applications
Statistics
ISBN:
9781119256830
Author:
Amos Gilat
Publisher:
John Wiley & Sons Inc
Probability and Statistics for Engineering and th…
Statistics
ISBN:
9781305251809
Author:
Jay L. Devore
Publisher:
Cengage Learning
Statistics for The Behavioral Sciences (MindTap C…
Statistics
ISBN:
9781305504912
Author:
Frederick J Gravetter, Larry B. Wallnau
Publisher:
Cengage Learning

Elementary Statistics: Picturing the World (7th E…
Statistics
ISBN:
9780134683416
Author:
Ron Larson, Betsy Farber
Publisher:
PEARSON

The Basic Practice of Statistics
Statistics
ISBN:
9781319042578
Author:
David S. Moore, William I. Notz, Michael A. Fligner
Publisher:
W. H. Freeman

Introduction to the Practice of Statistics
Statistics
ISBN:
9781319013387
Author:
David S. Moore, George P. McCabe, Bruce A. Craig
Publisher:
W. H. Freeman