Sample proportion: 62.29% Sample size: 7,280,980 Send individual texts & have 4 people gue standard deviation
Sample proportion: 62.29% Sample size: 7,280,980 Send individual texts & have 4 people gue standard deviation

Big Ideas Math A Bridge To Success Algebra 1: Student Edition 2015
1st Edition
ISBN:9781680331141
Author:HOUGHTON MIFFLIN HARCOURT
Publisher:HOUGHTON MIFFLIN HARCOURT
Chapter11: Data Analysis And Displays
Section11.3: Shapes Of Distributions
Problem 20E

Related questions
Question
M5
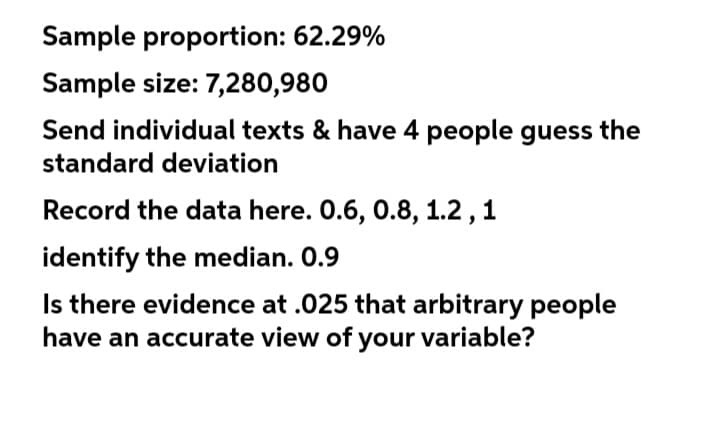
Transcribed Image Text:Sample proportion: 62.29%
Sample size: 7,280,980
Send individual texts & have 4 people guess the
standard deviation
Record the data here. 0.6, 0.8, 1.2, 1
identify the median. 0.9
Is there evidence at .025 that arbitrary people
have an accurate view of your variable?
Expert Solution
This question has been solved!
Explore an expertly crafted, step-by-step solution for a thorough understanding of key concepts.

Step by step
Solved in 2 steps

Recommended textbooks for you
Big Ideas Math A Bridge To Success Algebra 1: Stu…
Algebra
ISBN:
9781680331141
Author:
HOUGHTON MIFFLIN HARCOURT
Publisher:
Houghton Mifflin Harcourt
Big Ideas Math A Bridge To Success Algebra 1: Stu…
Algebra
ISBN:
9781680331141
Author:
HOUGHTON MIFFLIN HARCOURT
Publisher:
Houghton Mifflin Harcourt