Sampling 4 pieces of precision-cut wire (to be used in computer assembly) every hour for the past 24 hours has produced the following results: Heur
Sampling 4 pieces of precision-cut wire (to be used in computer assembly) every hour for the past 24 hours has produced the following results: Heur

Glencoe Algebra 1, Student Edition, 9780079039897, 0079039898, 2018
18th Edition
ISBN:9780079039897
Author:Carter
Publisher:Carter
Chapter10: Statistics
Section10.1: Measures Of Center
Problem 9PPS

Related questions

Question
100%
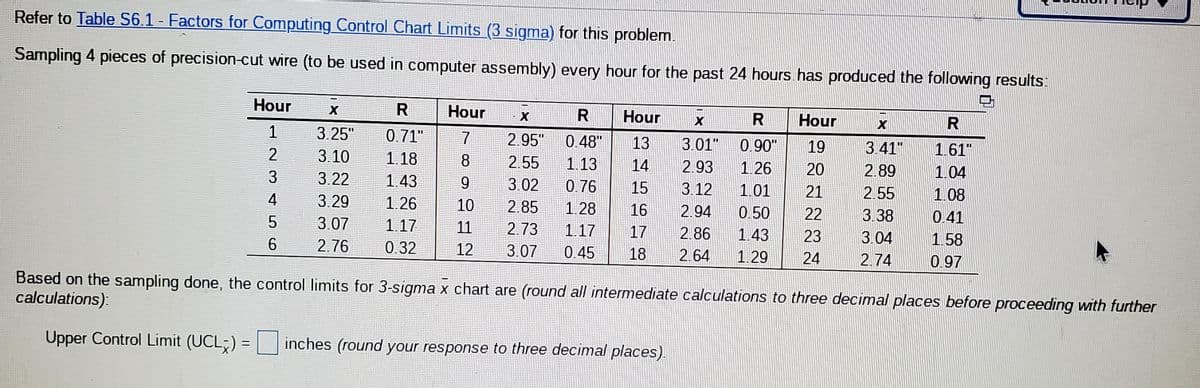
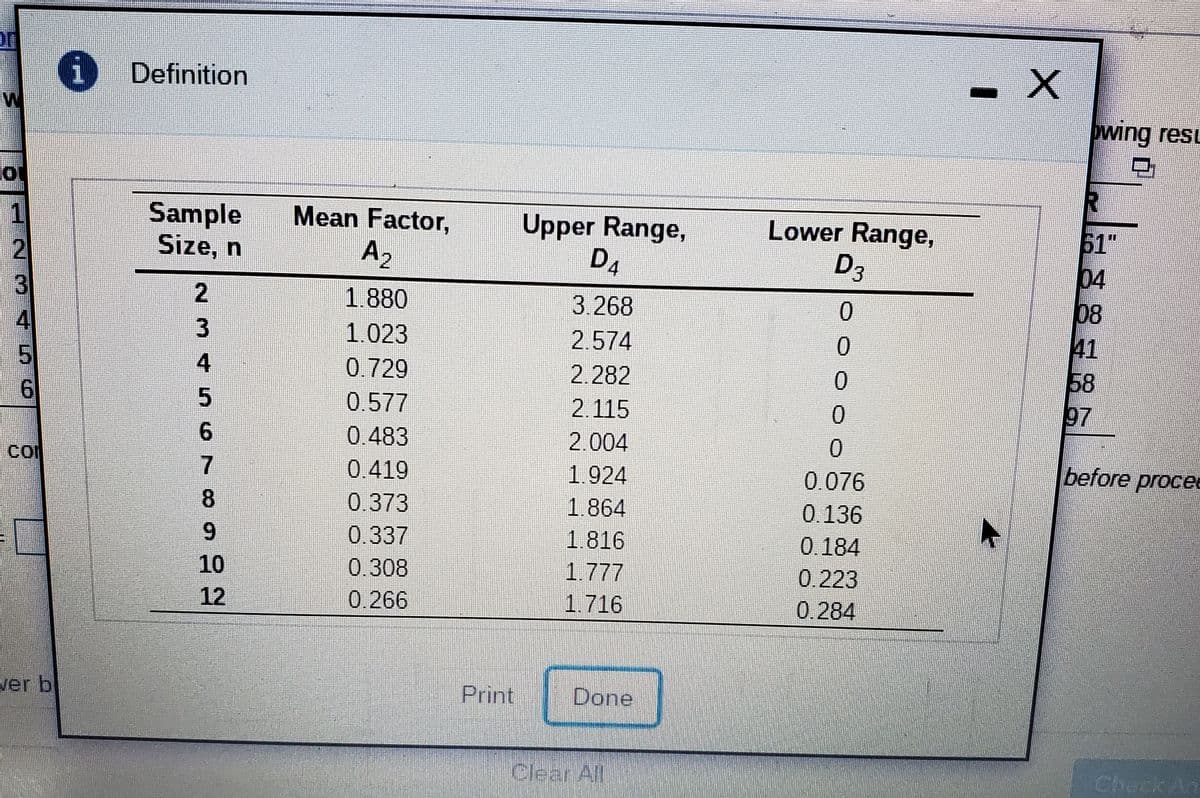
Transcribed Image Text:Refer to Table S6.1 - Factors for Computing Control Chart Limits (3 sigma) for this problem.
Sampling 4 pieces of precision-cut wire (to be used in computer assembly) every hour for the past 24 hours has produced the following results:
Hour
Hour
Hour
Hour
3.25"
0.71"
7
2.95"
0.48"
13
3.01"
%3D
0.90"
19
3.41"
1.61"
%3D
3.10
1.18
8
2.55
1.13
14
2.93
3
3.22
1.26
20
2.89
1.04
1.43
9
3.02
0.76
15
3.12
1.01
21
4
3.29
1.26
2.55
1.08
10
2.85
1.28
16
2.94
0.50
22
3.38
3.07
1.17
11
0.41
2.73
1.17
17
2.86
1.43
23
3.04
1.58
2.76
0.32
12
3.07
0.45
18
2.64
1.29
24
2.74
0.97
Based on the sampling done, the control limits for 3-sigma x chart are (round all intermediate calculations to three decimal places before proceeding with further
calculations):
Upper Control Limit (UCL;) = inches (round your response to three decimal places).
Transcribed Image Text:i Definition
pwing resu
Lower Range,
D3
51"
04
08
41
58
97
Sample
Size, n
Mean Factor,
A2
Upper Range,
DA
3
4
1.880
3.268
0.
1.023
2.574
0.
4
0.729
2.282
0.577
2.115
0.
9.
0.483
2.004
before procee
co
0.419
1.924
0.076
8.
0.373
1.864
0.136
6.
0.337
1.816
0.184
10
0.308
1.777
0.223
12
0.266
1.716
0.284
Print
Done
ver b
Clear All
Cherk A
Expert Solution
This question has been solved!
Explore an expertly crafted, step-by-step solution for a thorough understanding of key concepts.

This is a popular solution!

Trending now
This is a popular solution!

Step by step
Solved in 3 steps with 3 images

Knowledge Booster


Learn more about
Need a deep-dive on the concept behind this application? Look no further. Learn more about this topic, statistics and related others by exploring similar questions and additional content below.Recommended textbooks for you
Glencoe Algebra 1, Student Edition, 9780079039897…
Algebra
ISBN:
9780079039897
Author:
Carter
Publisher:
McGraw Hill
Glencoe Algebra 1, Student Edition, 9780079039897…
Algebra
ISBN:
9780079039897
Author:
Carter
Publisher:
McGraw Hill