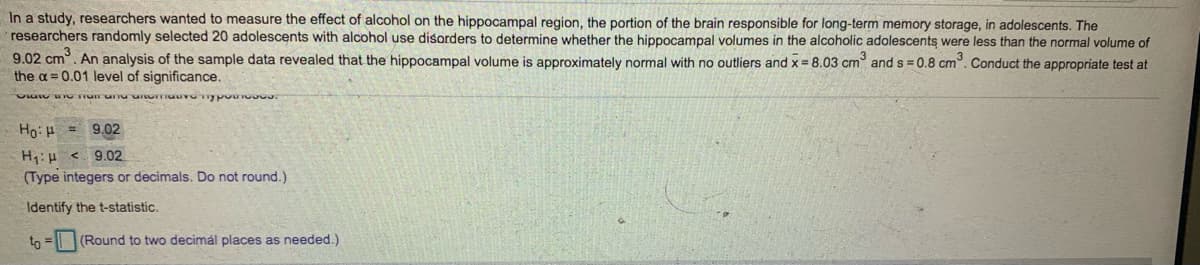
Identify the t-statistic. to = (Round to two decimál places as needed.)


Q: your score in the original distribution?
A: Since , the original distribution has a mean 35 and standard deviation is 8 Also , the new…
Q: According to the Distribution of Z table, ______ % of area is below a Z value of -0.50?
A: Using a standard normal table area to the left of z score, look up for z value -0.50 i.e., -0.5 in…
Q: ects several samples from the manufacturer and records the following learned in Forecasting,…
A: Given: The data given is as shown below Temperature (x) Strength (y) 185 5150 183 5125 187…
Q: The scores of 40,000 county employees who took a recent civil service exam were normally distributed…
A: It is given that the scores follow normal distribution with mean 70 and standard deviation 10.…
Q: Calculate M and N b) Average of the attendance in every 10 minutes c) 60th Percentile – 3rd Decile
A: The data of attendance of visitor for every 10 minutes is, 82, 97, 56, M, 58, 84, 73, 11, 94, 36,…
Q: uppose that the resting h stributed with mean 80 a /hat heart rate would a m
A: Let X be a random variable with mean 80 and s.d. 15 that follows a normal distribution. So,…
Q: The 78th percentile i (Round to two decimal places as needed.)
A: Here use normal distribution table for finding z score
Q: er. What will the removal of this datapoint do to the
A: Here interprete the given dot plot and derive the conclusion
Q: Which of these would be considered a transformed score? a. percentile ranks and t scores b. z scores…
A: Transformed scores are those scores that have been converted from raw scores to meaningful score…
Q: Ex. X = 400 Y = 700 Exr = 15, 000 Σε X2 = 16, 229 y2 = 50, 000
A:
Q: ..... The value of the test statistic is (Round to two decimal places as needed.)
A: Given : sample size, n = 480 population proportion,p= 0.5 sample proportion…
Q: fined as the percentage of a specified number of se he following data for time
A: Given ,
Q: е. Find her percentile scores for the two exams. (use R-code)
A: The score of Mathematics is 94.6 and the score of Physics is 93.7 Mean score of mathematics 86.1…
Q: Find the proportion of Normally distributed observations with a z-score below 2.56. Give your answer…
A: Given Z=2.56
Q: The following data is for the first quiz and second quiz scores. Predict the value of the second…
A: Given data, X Y X*Y X*X 10 9 90 100 11 12 132 121 15 14 210 225 22 18 396 484
Q: Find the percentile that corresponds to a specific data value x by using the following formula.…
A:
Q: Calculate (x-bar) for the data shown, to two decimal places
A: Calculate Mean from the following data17.9,2.6,6.3,16.4,24.2,26.1,18.7,18.4,9.1,5.7
Q: а. Construct an FDT for the data using five class intervals b. What the table tells you, what can…
A:
Q: a) Find the first quartile, Q1. b) Find the third quartile, Q3. c) Find the interquartile range.
A:
Q: c) Find the z-scores corresponding to 66 inches (5 ½ feet) and 72 inches (6 feet).
A: The mean is 70 and the standard deviation is 4.
Q: Use the dotplots to find the mean, median, and IOR of quie grades for each dass. Round to 1 decimal…
A: Based on the given dot plot, the data of Class A is: 3, 5, 5, 6, 6, 7, 7, 7, 8, 8, 8, 8, 8, 9, 9 and…
Q: The value of the test statistic is (Round to two decimal places as needed.)
A: The test statistic formula is, t=x¯-μsn In the formula, x¯ is sample mean, μ is population mean, s…
Q: A doctor notes her patients temperature in degrees Fahrenheit every hour to make sure the peat isn’t…
A: We have to find the level of measurement of data for temperature. There are four level of…
Q: What percentage of candidates will likely score below ftable is given as State of Nature Decision S1…
A: *answer:
Q: . Find the average run length to see a shift to P(bar)=0.19 on P control chart if 30, UCL= 0.321,…
A: Given information: Given that the control limits of p-control are as given below:
Q: Based on the diagram below make a flowchart for a t test for a mean.
A: Given:
Q: The following daily temperatures were recorded at three-hour intervals. Find the midrange of the…
A: The midrange is defined as the value that is halfway between the minimum data value and the maximum…
Q: Identify what is asked. Show your complete solutions and interpret the results on a separate sheet…
A: “Since you have asked multiple questions, we will solve the first question for you. If you want any…
Q: A random sample was taken and the data is shown below. For the data shown, answer the questions.…
A: Mean: The arithmetic mean (also called the mean) is the most commonly used measure of central…
Q: For a set of 15 numbers, Er=1005 and Ex = 67710. For a second set of 20 numbers, Ey=1044 and Ey =…
A:
Q: d. Find the Inter Quartile Range (IQR) for time spent at the hot springs. Q1: minutes Q3: minutes…
A:
Q: For each letter, represent in a normal curve.
A: So, in the above data we see that we have z-scores for 3 data. Male and female shorter than 5 feet…
Q: The 14th percentile is (Round to two decimal places as needed.)
A: Given that mean μ = 41standard deviation σ = 9we need to calculate P (X < x) = 0.14
Q: The median is a measure of Select one: OA central location O B. relative dispersion Oc absolute…
A: Median: median is the middle most value of the given data set.
Q: Calculate the test statistic. t-0 (Round to three decimal places as needed.)
A: Given: No. of bags, n=8 Percentage of unpopped kernels (X) 12.4 2.9 8.6 8.1 13.4 3.2…
Q: View the attatched photo and then answer the questions below. Thank you :) Min = ? Quartile 1 (Q1)…
A: We want to find the value of min,Quartile1(Q1),Quartile2(Q2),Quartile3(Q3),max
Q: Use a T-test of the data given in the picture, compare it with a P value(one tailed) and do a…
A: The three pairs Male and Female, Male and Male and injected male and male, and objective is to apply…
Q: d. Find the Inter Quartile Range (IQR) for time spent at the hot springs. Q1: minutes Q3: IQR:…
A:
Q: ean is (Round to the nearest tenth as needed.) measures of central tendency, including the midrange.…
A: X 43 51 11 91 77 36 64 37 42 72 54 62 36 75 51 72 37 29 39…
Q: Calculate the standard score of the given X value, X=36.5, where μ=36.7 and σ=32.5. Round your…
A: According to the given question, the standard score of the given X value, when
Q: Find the test statistic. (Round to two decimal places as needed.)
A: The sample proportion is, p^=xn=219700=0.312857 The sample proportion is 0.312857.
Q: State whether the z-score locates the raw score x within a sample or within a population…
A: Solution: Given data ×=50, s=5, x̄ =40 To find: Whether the z-score locates the raw score x…
Q: z value that corresponds to the 81 percentile.
A: Given Random Variable X~N(0,1) we have to find a Z value corresponding to the 81 Percentile that is…
Q: pne-half make less than $5.37 per hour. What measure of central tendency was most probably used…
A: Our aim is to find the which measure of central tendency was most probably used in this situation.
Q: Use the dot plots to find the mean, median, and IQR of each class. Round to 1 decimal place, if…
A: There are two classes A and B having the dot plots.
Q: percentage of women that received the treatment showed hair growth of 1-2 inches? Answer: Blank 1:…
A: Solution
Q: The mean is (Round to three decimal places as needed.)
A: Given : n=100 , p=23.9%=0.239 Our aim is to find the mean. Here , we use the binomial distribution.…
Q: Find the area below 47 for a N(60,10) distribution.
A:
Q: Find the z score for test scores of 70 _____ and 90 ______.
A: The z-score of a sample data is Here, mean is 70.3 and standard deviation is 13.5.

Step by step
Solved in 2 steps with 3 images


- In a study, researchers wanted to measure the effect of alcohol on the hippocampal region, the portion of the brain responsible for long-term memory storage, in adolescents. The researchers randomly selected 15 adolescents with alcohol use disorders to determine whether the hippocampal volumes in the alcoholic adolescents were less than the normal volume of 9.02 cm3. An analysis of the sample data revealed that the hippocampal volume is approximately normal with no outliers and x=8.02 cm3 and s=0.7 cm3. Conduct the appropriate test at the α=0.01 level of significance. Identify the t-statistic. t0=_____? (Round to two decimal places as needed.) Identify the P-value. P-value=____? (Round to three decimal places as needed.) State the null and alternative hypotheses.In a study, researchers wanted to measure the effect of alcohol on the hippocampal region, the portion of the brain responsible for long-term memory storage, in adolescents. The researchers randomly selected 11 adolescents with alcohol use disorders to determine whether the hippocampal volumes in the alcoholic adolescents were less than the normal volume of 9.02 cm3. An analysis of the sample data revealed that the hippocampal volume is approximately normal with no outliers and x=8.06 cm3 and s=0.7 cm3. Conduct the appropriate test at the α=0.01 level of significance. State the null and alternative hypotheses. H0: μ ▼ less than< greater than> equals= not equals≠ nothing H1: μ ▼ less than< not equals≠ equals= greater than> nothing (Type integers or decimals. Do not round.) Identify the t-statistic. t0=nothing (Round to two decimal places as needed.) Identify the P-value. P-value=nothing (Round to three decimal places as needed.)…In a study, researchers wanted to measure the effect of alcohol on the hippocampal region, the portion of the brain responsible for long-term memory storage, in adolescents. The researchers randomly selected 24 adolescents with alcohol use disorders to determine whether the hippocampal volumes in the alcoholic adolescents were less than the normal volume of 9.02 cm3. An analysis of the sample data revealed that the hippocampal volume is approximately normal with no outliers and x=8.04 cm3 and s=0.7 cm3. Conduct the appropriate test at the α=0.01 level of significance. State the null and alternative hypotheses.…
- In a study, researchers wanted to measure the effect of alcohol on the hippocampal region, the portion of the brain responsible for long-term memory storage, in adolescents. The researchers randomly selected 21 adolescents with alcohol use disorders to determine whether the hippocampal volumes in the alcoholic adolescents were less than the normal volume of 9.02cm3. An analysis of the sample data revealed that the hippocampal volume is approximately normal with no outliers and x=8.14 cm3 and s=0.7 cm3. Conduct the appropriate test at the α=0.01 level of significance. find the p valueIn a study, researchers wanted to measure the effect of alcohol on the hippocampal region, the portion of the brain responsible for long-term memory storage, in adolescents. The researchers randomly selected 17 adolescents with alcohol use disorders to determine whether the hippocampal volumes in the alcoholic adolescents were less than the normal of 9.02 cm3. An analysis of the sample data revealed that the hippocampal volume is approximately normal with no outliers and x = 8.17 cm3 and s = 0.7 cm3. Conduct the appropriate test at the a = 0.01 level of significance. to = -5.01 P-value = 0 Make a conclusion regarding the hypothesis. Reject the null hypothesis. There is sufficient evidence to claim that the mean hippocampal volume is less than _____ cm3.In a study, researchers wanted to measure the effect of alcohol on the hippocampal region, the portion of the brain responsible for long-term memory storage, in adolescents. The researchers randomly selected 21 adolescents with alcohol use disorders to determine whether the hippocampal volumes in the alcoholic adolescents were less than the normal volume of 8.75 cm3. An analysis of the sample data revealed that the hippocampal volume is approximately normal with no outliers and x=7.82 cm3 and s=0.7 cm3. Conduct the appropriate test at the α=0.05 level of significance Click the icon to view the table of critical t-values. State the null and alternative hypotheses. H0: U H1: U
- In a study, researchers wanted to measure the effect of alcohol on the hippocampal region, the portion of the brain responsible for long-term memory storage, in adolescents. The researchers randomly selected 17 adolescents with alcohol use disorders to determine whether the hippocampal volumes in the alcoholic adolescents were less than the normal volume of 9.02 cm3. An analysis of the sample data revealed that the hippocampal volume is approximately normal with no outliers and x barred = 8.17 cm3 and s = 0.7 cm3. Conduct the appropriate test at the a = 0.01 level of significance. identify the t-statistic to = ____ (round to two decimal places as needed)In a study, researchers wanted to measure the effect of alcohol on the hippocampal region, the portion of the brain responsible for long-term memory storage, in adolescents. The researchers randomly selected 22 adolescents with alcohol use disorders to determine whether the hippocampal volumes in the alcoholic adolescents were less than the normal volume of 9.02cm3 An analysis of the sample data revealed that the hippocampal volume is approximately normal with no outliers and x overbarxequals=8.03cm3 and sequals=0.7 cm3. Conduct the appropriate test at the alphaαequals=0.01In a study, researchers wanted to measure the effect of alcohol on the hippocampal region, the portion of the brain responsible for long-term memory storage, in adolescents. The researchers randomly selected 10 adolescents with alcohol use disorders to determine whether the hippocampal volumes in the alcoholic adolescents were less than the normal volume of 9.02 cm^3. An analysis of the sample data revealed that the hippocampal volume is approximately normal with no outliers and x(bar) = 8.15 cm^3 and s = 0.7 cm^3. Conduct the appropriate test at the a=0.01 level of significance.
- A large nationwide survey showed that 65% of high school students like Coca-Cola better than Pepsi. Dr.Johnson conducted a small survey of randomly selected high school students in Michigan and found that 180 ofthe 300 surveyed students liked Coca-Cola better than Pepsi. Test if the proportion of students that preferCoca-Cola over Pepsi is significantly different than the percentage indicated by the nationwide survey with asignificance level of 5%.10.3 #4 In a study, researchers wanted to measure the effect of alcohol on the hippocampal region, the portion of the brain responsible for long-term memory storage, in adolescents. The researchers randomly selected 20 adolescents with alcohol use disorders to determine whether the hippocampal volumes in the alcoholic adolescents were less than the normal volume of 9.02 cm3. An analysis of the sample data revealed that the hippocampal volume is approximately normal with no outliers and x=8.12 cm3 and s=0.8 cm3. Conduct the appropriate test at the α=0.01 level of significance. a) identify the t statistic b) identify the p value c) concludeIn the general population, Democrats are estimated to have an average mental health index score of during this time period, with a 95% margin of error of . Respondents with MHI scores of 12 or higher are known to be at very high risk for mental health complications. Among Democrats, approximately percent are at very high risk for mental health complications. An MHI score above 7 is considered indicative of life conditions that are at least moderately stressful. Among Democrats, approximately percent are experiencing life conditions that are at least moderately stressful.
