Sampling 4 pieces of precision-cut wire (to be used in computer assembly) every hour for the past 24 hours has produced the following results: X R 3.25" 0.76" 3.00 1.13 1.43 1.21 1.12 0.32 3.22 Hour x R Hour X R Hour 7 3.15" 0.48" 13 3.01" 0.90" 19 3.31" 8 2.65 1.08 14 2.73 1.26 20 2.79 9 2.92 0.71 15 3.12 1.11 21 2.55 10 2.75 1.28 16 2.74 0.50 22 11 2.73 1.12 17 2.96 1.48 23 2.97 0.40 18 2.84 1.34 24 3.49 3.17 2.96 12 Hour 1 2 3 4 5 6 R 1.56" 1.09 1.08 0.46 3.18 2.84 2.54 0.92 1.58 Based on the sampling done, the control limits for 3-sigma x chart are (round all intermediate calculations to three decimal places before proceeding with further calculations): Upper Control Limit (UCL.) = inches (round your response to three decimal places).
Sampling 4 pieces of precision-cut wire (to be used in computer assembly) every hour for the past 24 hours has produced the following results: X R 3.25" 0.76" 3.00 1.13 1.43 1.21 1.12 0.32 3.22 Hour x R Hour X R Hour 7 3.15" 0.48" 13 3.01" 0.90" 19 3.31" 8 2.65 1.08 14 2.73 1.26 20 2.79 9 2.92 0.71 15 3.12 1.11 21 2.55 10 2.75 1.28 16 2.74 0.50 22 11 2.73 1.12 17 2.96 1.48 23 2.97 0.40 18 2.84 1.34 24 3.49 3.17 2.96 12 Hour 1 2 3 4 5 6 R 1.56" 1.09 1.08 0.46 3.18 2.84 2.54 0.92 1.58 Based on the sampling done, the control limits for 3-sigma x chart are (round all intermediate calculations to three decimal places before proceeding with further calculations): Upper Control Limit (UCL.) = inches (round your response to three decimal places).

College Algebra (MindTap Course List)
12th Edition
ISBN:9781305652231
Author:R. David Gustafson, Jeff Hughes
Publisher:R. David Gustafson, Jeff Hughes
Chapter8: Sequences, Series, And Probability
Section8.7: Probability
Problem 6E: List the sample space of each experiment. Tossing three coins

Related questions
Question
REFER TO TABLE FOR QUESTION PLS THX
Transcribed Image Text:Sample
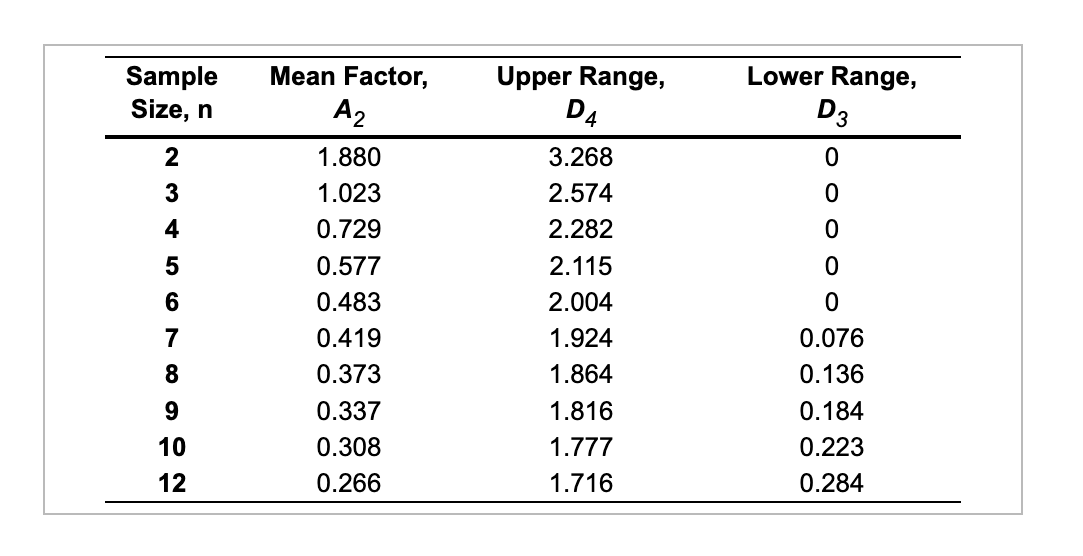
Size, n
2
3
4
5
6
7
89 10 12
Mean Factor,
A2
1.880
1.023
0.729
0.577
0.483
0.419
0.373
0.337
0.308
0.266
Upper Range,
D4
3.268
2.574
2.282
2.115
2.004
1.924
1.864
1.816
1.777
1.716
Lower Range,
D3
0
0
0
0
0
0.076
0.136
0.184
0.223
0.284
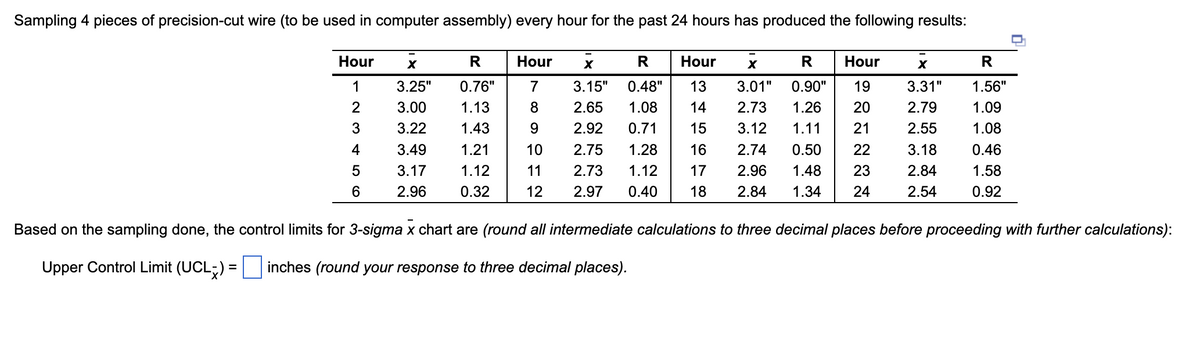
Transcribed Image Text:Sampling 4 pieces of precision-cut wire (to be used in computer assembly) every hour for the past 24 hours has produced the following results:
Hour X R Hour X
Hour
7
8
3.31"
2.79
X
R
3.15" 0.48" 13 3.01" 0.90" 19
2.65 1.08 14 2.73 1.26 20
2.92 0.71 15 3.12 1.11 21
2.75 1.28 16 2.74 0.50 22
2.73 1.12 17 2.96 1.48 23
2.97 0.40 18 2.84
24
2.55
9
10
11
12
3.18
2.84
1.34
2.54
Hour
1
2
3
4
5
6
X
3.25"
3.00
3.22
3.49
3.17
2.96
R
0.76"
1.13
1.43
1.21
1.12
0.32
R
1.56"
1.09
1.08
0.46
1.58
0.92
Based on the sampling done, the control limits for 3-sigma x chart are (round all intermediate calculations to three decimal places before proceeding with further calculations):
Upper Control Limit (UCL) = inches (round your response to three decimal places).
Expert Solution
This question has been solved!
Explore an expertly crafted, step-by-step solution for a thorough understanding of key concepts.

Step by step
Solved in 4 steps with 18 images

Recommended textbooks for you
College Algebra (MindTap Course List)
Algebra
ISBN:
9781305652231
Author:
R. David Gustafson, Jeff Hughes
Publisher:
Cengage Learning

Holt Mcdougal Larson Pre-algebra: Student Edition…
Algebra
ISBN:
9780547587776
Author:
HOLT MCDOUGAL
Publisher:
HOLT MCDOUGAL

College Algebra (MindTap Course List)
Algebra
ISBN:
9781305652231
Author:
R. David Gustafson, Jeff Hughes
Publisher:
Cengage Learning
Holt Mcdougal Larson Pre-algebra: Student Edition…
Algebra
ISBN:
9780547587776
Author:
HOLT MCDOUGAL
Publisher:
HOLT MCDOUGAL