sampling distribution (dotplot) for the mean quiz score for a sample n = 30 of STAT101 students is shown below. It was constructed using random samples from population data. If we increased our sample size from 30 to 100, would the standard error of the sample mean be larger, smaller, or the same? Explain your answer in one or two sentences.
sampling distribution (dotplot) for the mean quiz score for a sample n = 30 of STAT101 students is shown below. It was constructed using random samples from population data. If we increased our sample size from 30 to 100, would the standard error of the sample mean be larger, smaller, or the same? Explain your answer in one or two sentences.

Algebra & Trigonometry with Analytic Geometry
13th Edition
ISBN:9781133382119
Author:Swokowski
Publisher:Swokowski
Chapter10: Sequences, Series, And Probability
Section10.8: Probability
Problem 30E

Related questions
Question
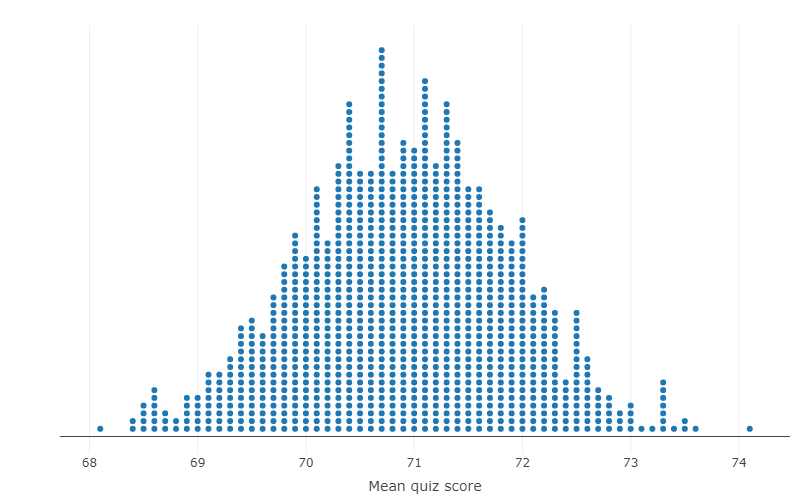
A sampling distribution (dotplot) for the mean quiz score for a sample n = 30 of STAT101 students is shown below. It was constructed using random samples from population data.
If we increased our sample size from 30 to 100, would the standard error of the sample mean be larger, smaller, or the same? Explain your answer in one or two sentences.
Transcribed Image Text:.…......
……………….
......
……………………….
…………………………
...
…....
...
0.00
.....
…………….
....
●●
74
73
72
Mean quiz score
71
70
69
89
Expert Solution
This question has been solved!
Explore an expertly crafted, step-by-step solution for a thorough understanding of key concepts.

Step by step
Solved in 2 steps with 2 images

Recommended textbooks for you
Algebra & Trigonometry with Analytic Geometry
Algebra
ISBN:
9781133382119
Author:
Swokowski
Publisher:
Cengage

Algebra & Trigonometry with Analytic Geometry
Algebra
ISBN:
9781133382119
Author:
Swokowski
Publisher:
Cengage