Click on the icon to view the standard normal table. Find the probability that the sample mean fuel consumption will be fewer than 27 miles per gallon if samples of 1, 4, and 9 are taken. The probability for a sample of 1 observation is (Round to four decimal places as needed) The probability for a sample of 4 observations is (Round to four decimal places as needed.) The probability for a sample of 9 observations is (Round to four decimal places as needed) b. Explain why the three answers in part (a) differ in the way they do. Draw a graph to illustrate your reasoning As the sample size increases, the mean of the sampling distribution of X and the standard deviation Therefore, the sample means tend to the population mean. Since 27 is less than the population mean, the portion of the sampling distribution of X that represents sample means fewer than 27 as the sample size increases Which graph shows the correct relationship between the sampling distributions of X for two samples of n, and n, observations, where ny is larger than n, and x is a sample mean less than the population mean?
Click on the icon to view the standard normal table. Find the probability that the sample mean fuel consumption will be fewer than 27 miles per gallon if samples of 1, 4, and 9 are taken. The probability for a sample of 1 observation is (Round to four decimal places as needed) The probability for a sample of 4 observations is (Round to four decimal places as needed.) The probability for a sample of 9 observations is (Round to four decimal places as needed) b. Explain why the three answers in part (a) differ in the way they do. Draw a graph to illustrate your reasoning As the sample size increases, the mean of the sampling distribution of X and the standard deviation Therefore, the sample means tend to the population mean. Since 27 is less than the population mean, the portion of the sampling distribution of X that represents sample means fewer than 27 as the sample size increases Which graph shows the correct relationship between the sampling distributions of X for two samples of n, and n, observations, where ny is larger than n, and x is a sample mean less than the population mean?

Glencoe Algebra 1, Student Edition, 9780079039897, 0079039898, 2018
18th Edition
ISBN:9780079039897
Author:Carter
Publisher:Carter
Chapter10: Statistics
Section10.4: Distributions Of Data
Problem 19PFA

Related questions
Question
1
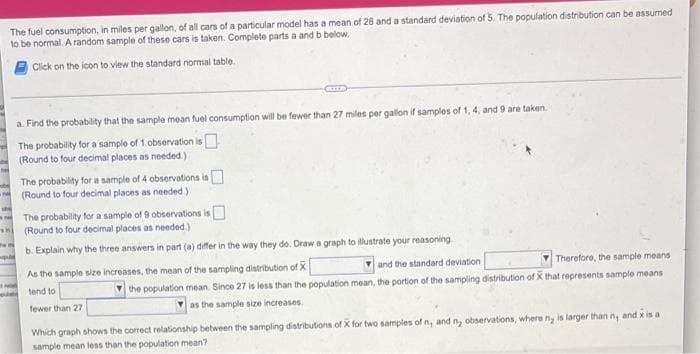
Transcribed Image Text:The fuel consumption, in miles per gallon, of all cars of a particular model has a mean of 28 and a standard deviation of 5. The population distribution can be assumed
to be normal. A random sample of these cars is taken. Complete parts a and b below.
Click on the icon to view the standard normal table.
CIEP
a. Find the probability that the sample mean fuel consumption will be fewer than 27 miles per gallon if samples of 1, 4, and 9 are taken.
The probability for a sample of 1 observation is
(Round to four decimal places as needed.)
The probability for a sample of 4 observations is
(Round to four decimal places as needed.)
The probability for a sample of 9 observations is
(Round to four decimal places as needed.)
b. Explain why the three answers in part (a) differ in the way they do. Draw a graph to illustrate your reasoning.
As the sample size increases, the mean of the sampling distribution of X
and the standard deviation
Therefore, the sample means
tend to
the population mean. Since 27 is less than the population mean, the portion of the sampling distribution of X that represents sample means
fewer than 27
as the sample size increases.
Which graph shows the correct relationship between the sampling distributions of X for two samples of n, and n, observations, where ny is larger than n, and x is a
sample mean less than the population mean?
whi
Expert Solution
This question has been solved!
Explore an expertly crafted, step-by-step solution for a thorough understanding of key concepts.

Step by step
Solved in 2 steps with 2 images

Recommended textbooks for you
Glencoe Algebra 1, Student Edition, 9780079039897…
Algebra
ISBN:
9780079039897
Author:
Carter
Publisher:
McGraw Hill
Glencoe Algebra 1, Student Edition, 9780079039897…
Algebra
ISBN:
9780079039897
Author:
Carter
Publisher:
McGraw Hill