(SAVE AS PDF) An industrial engineer wanted to determine the relationship of a person's intention to prepare (I) towards perceived vulnerability (PV) disaster. Using a 5-point Likert scale survey, he took a random sample of 10 participants from the mechanical engineering department. The percentage of da PV 11.2353 99.1735 4.0077 65.6575 95.9208 40.1498 82.4578 | 80.2064 74.7498 48.21 I 85.1272 67.6803| 78.5131 77 53.6637 82.8321 | 62.1502 | 43.4192 | 56.2354 | 75.892 a. Find the regression equation and construct the scatter plot diagram. b. Predict the intention to prepare with 36.67% perceived vulnerability average. s Calculate the coafficient of determination and interpret the findingS
(SAVE AS PDF) An industrial engineer wanted to determine the relationship of a person's intention to prepare (I) towards perceived vulnerability (PV) disaster. Using a 5-point Likert scale survey, he took a random sample of 10 participants from the mechanical engineering department. The percentage of da PV 11.2353 99.1735 4.0077 65.6575 95.9208 40.1498 82.4578 | 80.2064 74.7498 48.21 I 85.1272 67.6803| 78.5131 77 53.6637 82.8321 | 62.1502 | 43.4192 | 56.2354 | 75.892 a. Find the regression equation and construct the scatter plot diagram. b. Predict the intention to prepare with 36.67% perceived vulnerability average. s Calculate the coafficient of determination and interpret the findingS

Glencoe Algebra 1, Student Edition, 9780079039897, 0079039898, 2018
18th Edition
ISBN:9780079039897
Author:Carter
Publisher:Carter
Chapter4: Equations Of Linear Functions
Section4.5: Correlation And Causation
Problem 2CYU

Related questions
Question
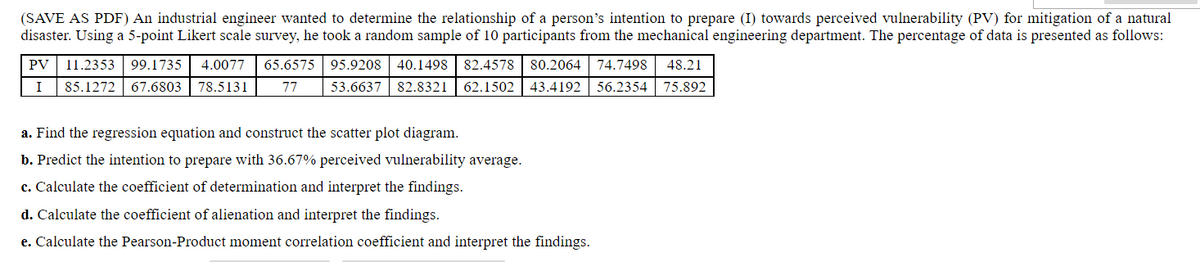
Transcribed Image Text:(SAVE AS PDF) An industrial engineer wanted to determine the relationship of a person's intention to prepare (I) towards perceived vulnerability (PV) for mitigation of a natural
disaster. Using a 5-point Likert scale survey, he took a random sample of 10 participants from the mechanical engineering department. The percentage of data is presented as follows:
PV
11.2353 99.1735
4.0077
65.6575 95.9208 | 40.1498
82.4578 | 80.2064
74.7498
48.21
I
85.1272
67.6803
78.5131
77
53.6637 82.8321
62.1502
43.4192
56.2354
75.892
a. Find the regression equation and construct the scatter plot diagram.
b. Predict the intention to prepare with 36.67% perceived vulnerability average.
c. Calculate the coefficient of determination and interpret the findings.
d. Calculate the coefficient of alienation and interpret the findings.
e. Calculate the Pearson-Product moment correlation coefficient and interpret the findings.
Expert Solution
This question has been solved!
Explore an expertly crafted, step-by-step solution for a thorough understanding of key concepts.

Step by step
Solved in 2 steps with 1 images

Recommended textbooks for you
Glencoe Algebra 1, Student Edition, 9780079039897…
Algebra
ISBN:
9780079039897
Author:
Carter
Publisher:
McGraw Hill
Glencoe Algebra 1, Student Edition, 9780079039897…
Algebra
ISBN:
9780079039897
Author:
Carter
Publisher:
McGraw Hill