Saved Profit per Unit (Price Average Total Revenue Cost Total Marginal Marginal Profit Revenue Cost Total Output per month Price Total Minus Cost Average Cost) $4 60,000 $1,000 $ $60,000 $900 $100 1,000 10,000 $ 1,000 1,000 200,000 130,000 70,000 1,000 1,000 300,000 180,000 120,000 1,000 400,000 240,000 160,000 1,000 500,000 320,000 180,000 1,000 600,000 420,000 180,000 1,000 700,000 546,000 154,000 1,000 800,000 720,000 80,000 1,000 900,000 919,800| -19,800 100 100,000| 90,000 $300 200 400 650 350 600 1,000 1,000 1,000 300 500 400 nces 400 600 600 400 500 800 640 360 1,000 1,000 700 300 600 700 1,260 1,740 1,998 1,000 780 220 800 1,000 900 100 900 1,000 1,022 -22 *Note that output levels are calibrated in hundreds in this example; that's why we have divided the change in total costs and revenues from one output level to another by 100 to calculate marginal revenue and marginal cost. Very few manufacturers deal in units of 1. (a) What were the fixed costs of production for the firm? < Prev 2 of 9 E Next > M. etion DELL Ce %23 24 *- 4 7 %24 # 3. %24
Saved Profit per Unit (Price Average Total Revenue Cost Total Marginal Marginal Profit Revenue Cost Total Output per month Price Total Minus Cost Average Cost) $4 60,000 $1,000 $ $60,000 $900 $100 1,000 10,000 $ 1,000 1,000 200,000 130,000 70,000 1,000 1,000 300,000 180,000 120,000 1,000 400,000 240,000 160,000 1,000 500,000 320,000 180,000 1,000 600,000 420,000 180,000 1,000 700,000 546,000 154,000 1,000 800,000 720,000 80,000 1,000 900,000 919,800| -19,800 100 100,000| 90,000 $300 200 400 650 350 600 1,000 1,000 1,000 300 500 400 nces 400 600 600 400 500 800 640 360 1,000 1,000 700 300 600 700 1,260 1,740 1,998 1,000 780 220 800 1,000 900 100 900 1,000 1,022 -22 *Note that output levels are calibrated in hundreds in this example; that's why we have divided the change in total costs and revenues from one output level to another by 100 to calculate marginal revenue and marginal cost. Very few manufacturers deal in units of 1. (a) What were the fixed costs of production for the firm? < Prev 2 of 9 E Next > M. etion DELL Ce %23 24 *- 4 7 %24 # 3. %24

Chapter1: Making Economics Decisions
Section: Chapter Questions
Problem 1QTC

Related questions
Question
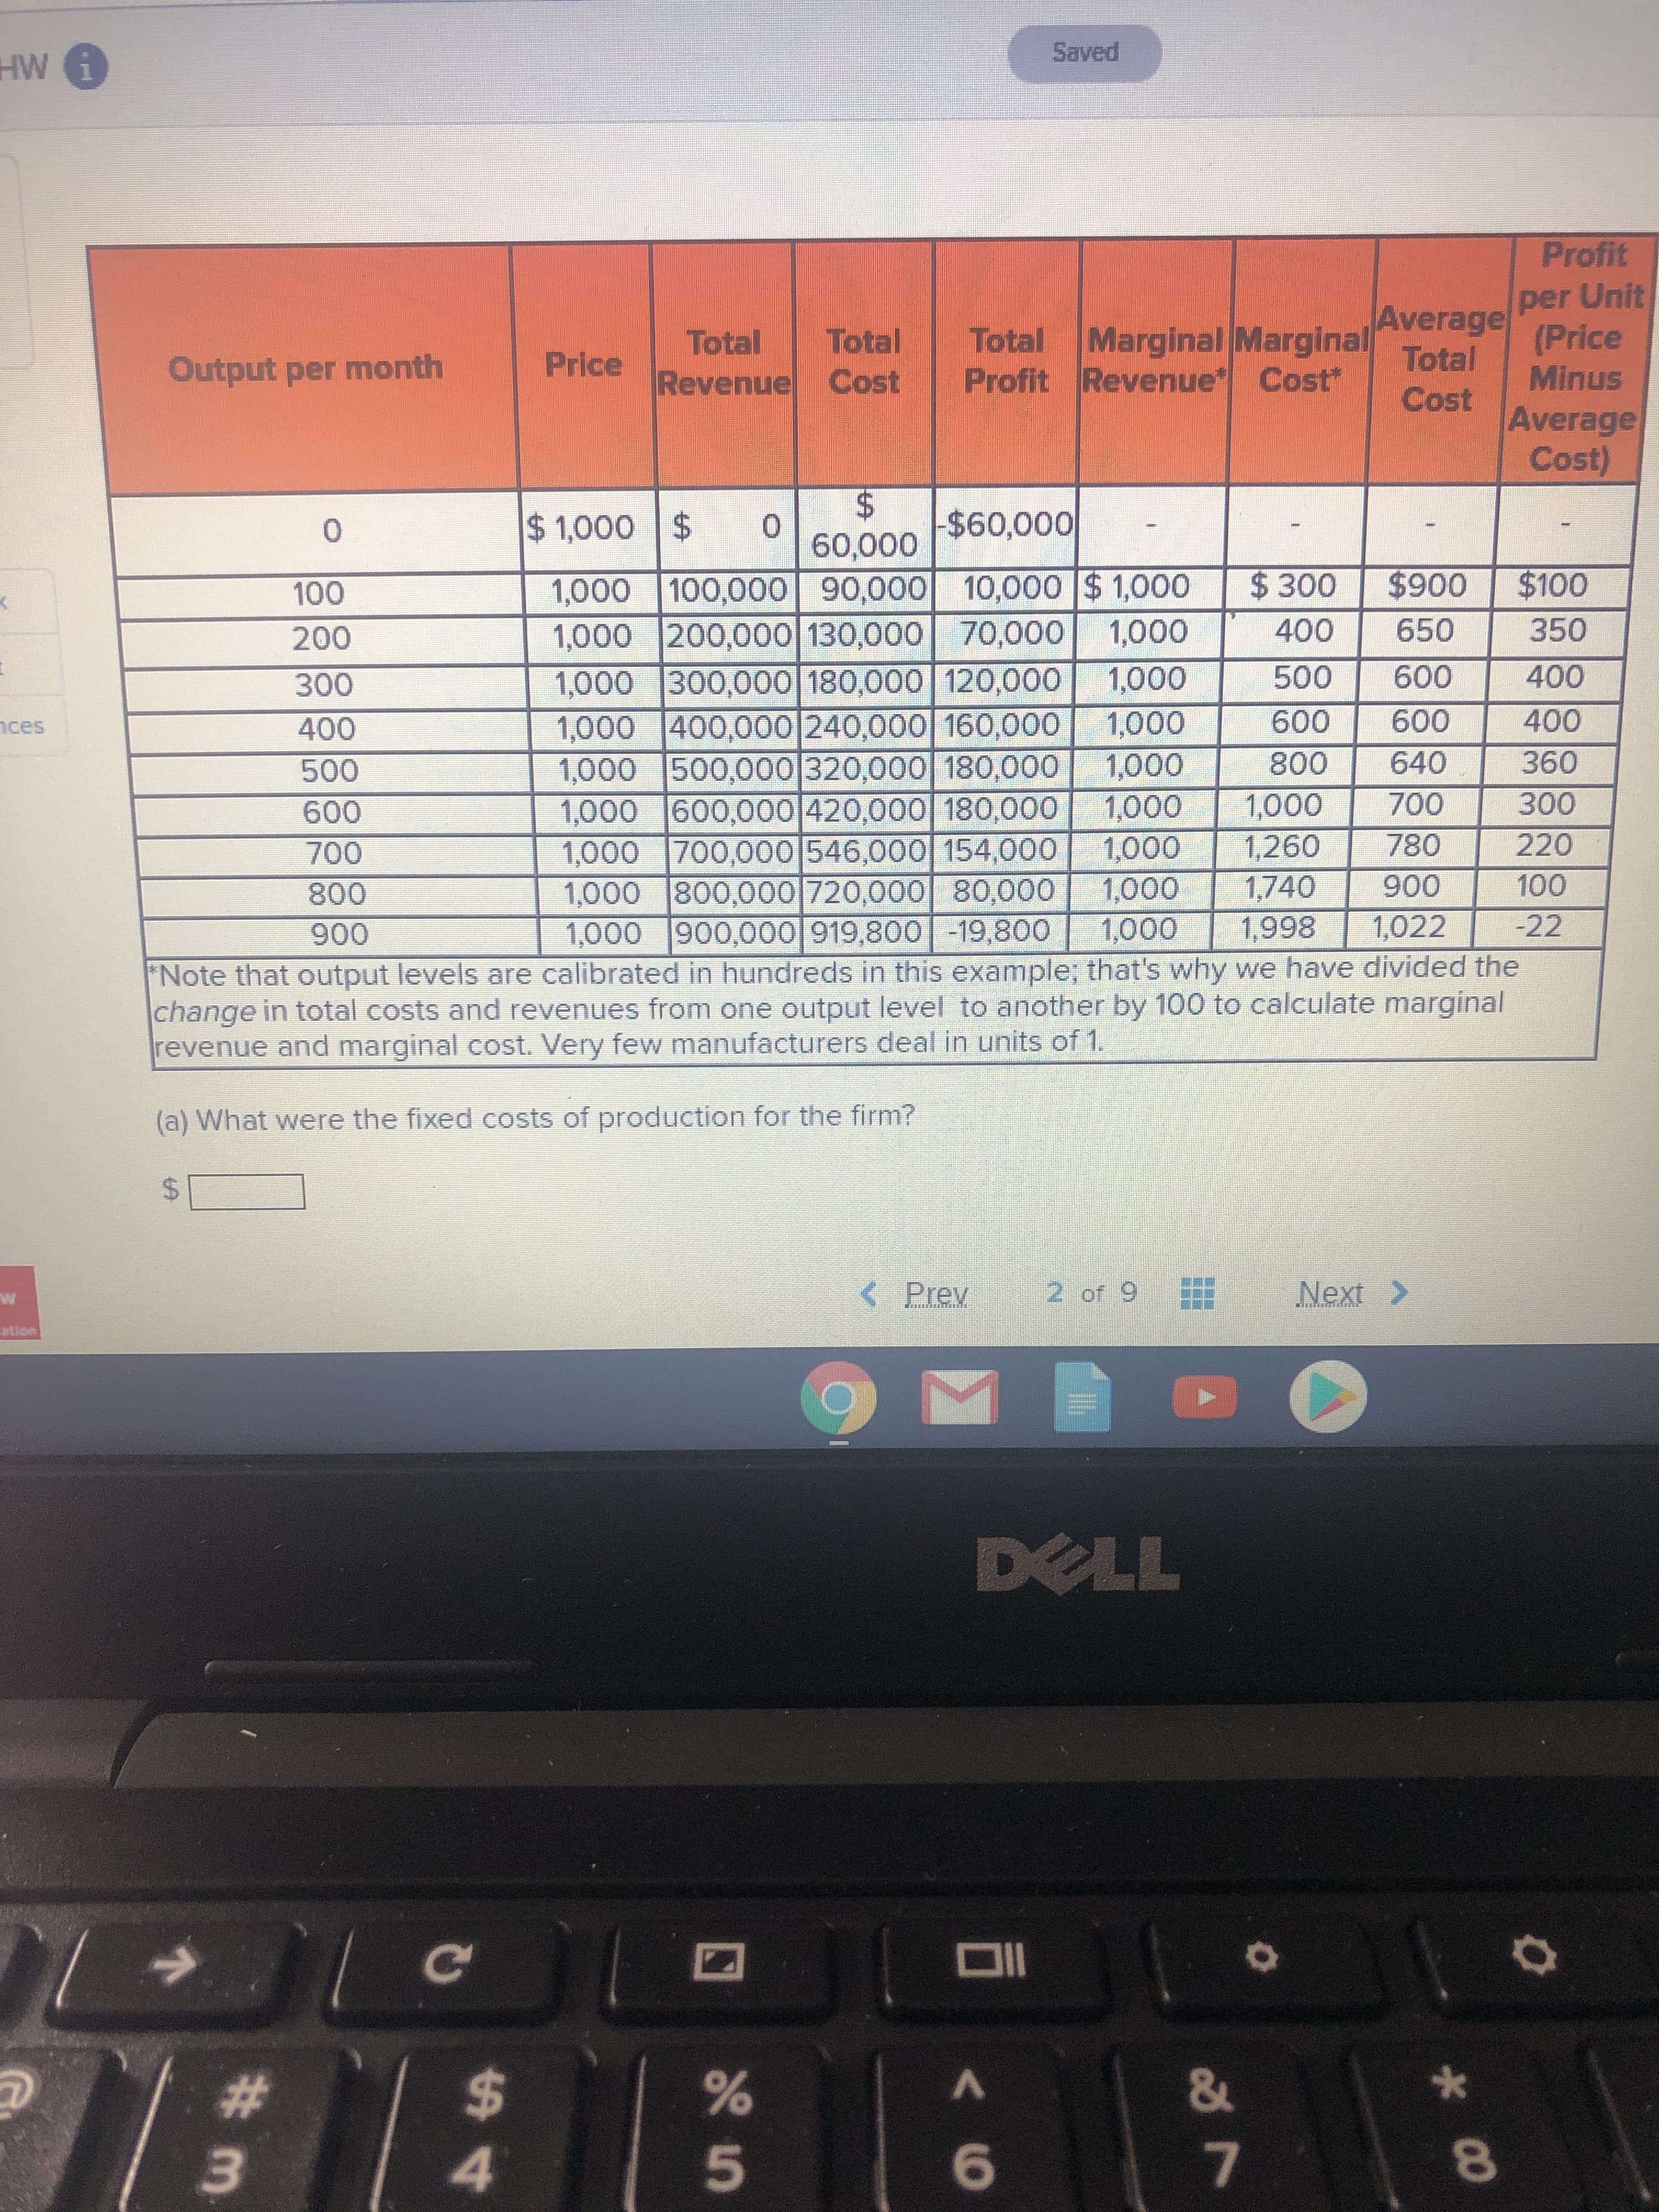
(A) what were the fixed costs of production for the firm?
(B) at what rate of output was profit computer maximized?(choose the highest output level.)
(C) at what output rate was total profit maximized? Computers per month
Transcribed Image Text:Saved
Profit
per Unit
(Price
Average
Total
Revenue Cost
Total Marginal Marginal
Profit Revenue Cost
Total
Output per month
Price
Total
Minus
Cost
Average
Cost)
$4
60,000
$1,000 $
$60,000
$900
$100
1,000 10,000 $ 1,000
1,000 200,000 130,000 70,000 1,000
1,000 300,000 180,000 120,000
1,000 400,000 240,000 160,000
1,000 500,000 320,000 180,000
1,000 600,000 420,000 180,000
1,000 700,000 546,000 154,000
1,000 800,000 720,000 80,000
1,000 900,000 919,800| -19,800
100
100,000| 90,000
$300
200
400
650
350
600
1,000
1,000
1,000
300
500
400
nces
400
600
600
400
500
800
640
360
1,000
1,000
700
300
600
700
1,260
1,740
1,998
1,000
780
220
800
1,000
900
100
900
1,000
1,022
-22
*Note that output levels are calibrated in hundreds in this example; that's why we have divided the
change in total costs and revenues from one output level to another by 100 to calculate marginal
revenue and marginal cost. Very few manufacturers deal in units of 1.
(a) What were the fixed costs of production for the firm?
< Prev
2 of 9 E
Next >
M.
etion
DELL
Ce
%23
24
*-
4
7
%24
# 3.
%24
Expert Solution
This question has been solved!
Explore an expertly crafted, step-by-step solution for a thorough understanding of key concepts.

This is a popular solution!

Trending now
This is a popular solution!

Step by step
Solved in 3 steps

Knowledge Booster


Learn more about
Need a deep-dive on the concept behind this application? Look no further. Learn more about this topic, economics and related others by exploring similar questions and additional content below.Recommended textbooks for you

Principles of Economics (12th Edition)
Economics
ISBN:
9780134078779
Author:
Karl E. Case, Ray C. Fair, Sharon E. Oster
Publisher:
PEARSON

Engineering Economy (17th Edition)
Economics
ISBN:
9780134870069
Author:
William G. Sullivan, Elin M. Wicks, C. Patrick Koelling
Publisher:
PEARSON
Principles of Economics (12th Edition)
Economics
ISBN:
9780134078779
Author:
Karl E. Case, Ray C. Fair, Sharon E. Oster
Publisher:
PEARSON
Engineering Economy (17th Edition)
Economics
ISBN:
9780134870069
Author:
William G. Sullivan, Elin M. Wicks, C. Patrick Koelling
Publisher:
PEARSON

Principles of Economics (MindTap Course List)
Economics
ISBN:
9781305585126
Author:
N. Gregory Mankiw
Publisher:
Cengage Learning

Managerial Economics: A Problem Solving Approach
Economics
ISBN:
9781337106665
Author:
Luke M. Froeb, Brian T. McCann, Michael R. Ward, Mike Shor
Publisher:
Cengage Learning

Managerial Economics & Business Strategy (Mcgraw-…
Economics
ISBN:
9781259290619
Author:
Michael Baye, Jeff Prince
Publisher:
McGraw-Hill Education