Scenario 1: The percentage of A's given in a physics course at a university over a long period of time was 10%. During one particular term there were 40 A's in a group of 300 students. Test if the percentage of students who got A's in the course is significantly greater than the previous years' result at 1% level of significance. Test the hypothesis in the given situation. Follow the steps in hypothesis testing and draw a conclusion. Write the null and alternative hypothesis in sentence form and in symbols. Shade the rejection region in the normal curve. Write the conclusion in statement form.
Scenario 1: The percentage of A's given in a physics course at a university over a long period of time was 10%. During one particular term there were 40 A's in a group of 300 students. Test if the percentage of students who got A's in the course is significantly greater than the previous years' result at 1% level of significance. Test the hypothesis in the given situation. Follow the steps in hypothesis testing and draw a conclusion. Write the null and alternative hypothesis in sentence form and in symbols. Shade the rejection region in the normal curve. Write the conclusion in statement form.

Holt Mcdougal Larson Pre-algebra: Student Edition 2012
1st Edition
ISBN:9780547587776
Author:HOLT MCDOUGAL
Publisher:HOLT MCDOUGAL
Chapter11: Data Analysis And Probability
Section: Chapter Questions
Problem 8CR

Related questions
Question
Provide a thorough explanation as to how the artwork exemplifies or uses a mathematical sequence or series. SKIP THIS IF YOU ALREADY HAVE ANSWERED. THANK YOU. I WILL UPVOTE
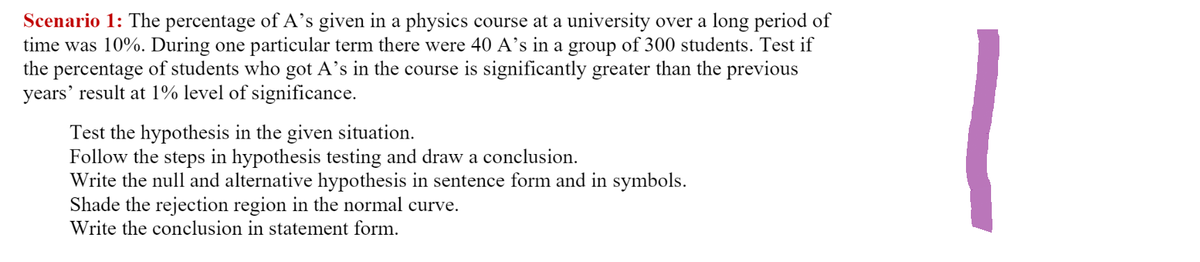
Transcribed Image Text:Scenario 1: The percentage of A's given in a physics course at a university over a long period of
time was 10%. During one particular term there were 40 A's in a group of 300 students. Test if
the percentage of students who got A's in the course is significantly greater than the previous
years' result at 1% level of significance.
Test the hypothesis in the given situation.
Follow the steps in hypothesis testing and draw a conclusion.
Write the null and alternative hypothesis in sentence form and in symbols.
Shade the rejection region in the normal curve.
Write the conclusion in statement form.
Expert Solution
This question has been solved!
Explore an expertly crafted, step-by-step solution for a thorough understanding of key concepts.

Step by step
Solved in 4 steps with 1 images

Recommended textbooks for you
Holt Mcdougal Larson Pre-algebra: Student Edition…
Algebra
ISBN:
9780547587776
Author:
HOLT MCDOUGAL
Publisher:
HOLT MCDOUGAL

College Algebra
Algebra
ISBN:
9781305115545
Author:
James Stewart, Lothar Redlin, Saleem Watson
Publisher:
Cengage Learning
Holt Mcdougal Larson Pre-algebra: Student Edition…
Algebra
ISBN:
9780547587776
Author:
HOLT MCDOUGAL
Publisher:
HOLT MCDOUGAL
College Algebra
Algebra
ISBN:
9781305115545
Author:
James Stewart, Lothar Redlin, Saleem Watson
Publisher:
Cengage Learning