Based on the data shown below, calculate the regression line (each value to at least two decimal places) y= X+ y 9.55 9.62 3 6.99 4 8.76 5 7.33 6 4.1 X 1 2
Based on the data shown below, calculate the regression line (each value to at least two decimal places) y= X+ y 9.55 9.62 3 6.99 4 8.76 5 7.33 6 4.1 X 1 2

Functions and Change: A Modeling Approach to College Algebra (MindTap Course List)
6th Edition
ISBN:9781337111348
Author:Bruce Crauder, Benny Evans, Alan Noell
Publisher:Bruce Crauder, Benny Evans, Alan Noell
Chapter3: Straight Lines And Linear Functions
Section3.4: Linear Regression
Problem 12SBE: Find the equation of the regression line for the following data set. x 1 2 3 y 0 3 4

Related questions
Question
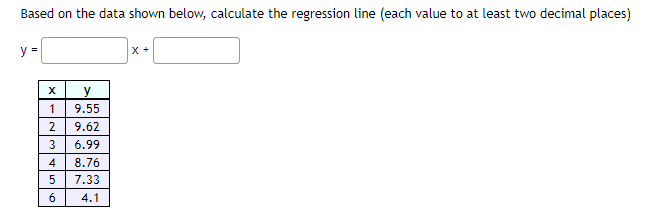
Question 23: Based on the data shown below, calculate the regression line (each value to at least two decimal places)
y = x +
| x | y |
|---|---|
| 1 | 9.55 |
| 2 | 9.62 |
| 3 | 6.99 |
| 4 | 8.76 |
| 5 | 7.33 |
| 6 | 4.1 |
Transcribed Image Text:Based on the data shown below, calculate the regression line (each value to at least two decimal places)
y =
X+
X
y
1
9.55
2
9.62
3
6.99
4 8.76
5
7.33
6
4.1
Expert Solution
This question has been solved!
Explore an expertly crafted, step-by-step solution for a thorough understanding of key concepts.

This is a popular solution!

Trending now
This is a popular solution!

Step by step
Solved in 3 steps with 3 images

Recommended textbooks for you
Functions and Change: A Modeling Approach to Coll…
Algebra
ISBN:
9781337111348
Author:
Bruce Crauder, Benny Evans, Alan Noell
Publisher:
Cengage Learning

Functions and Change: A Modeling Approach to Coll…
Algebra
ISBN:
9781337111348
Author:
Bruce Crauder, Benny Evans, Alan Noell
Publisher:
Cengage Learning