Scenario: A mathematics placement test is given to all entering freshmen at a small college. A student who receives a grade below 35 is denied admission to the regular mathematics course and placed in a remedial class. A study about the correlation between the placement scores and the final course grade is being written and the placement test scores and final grades for a group of students who took the regular course were recorded as follows: Placement Course Test Grade 50 53 35 41 35 61 40 56 55 68 65 36 35 11 60 70 90 79 35 59 90 54 80 91 60 48 60 71 60 40 55 50 65 50 79 Plot a scatter diagram of the data. Compute for the correlation coefficient and interpret the result. (Write your interpretation in statement form) ||4|3|6|5| 71 47 68 57
Scenario: A mathematics placement test is given to all entering freshmen at a small college. A student who receives a grade below 35 is denied admission to the regular mathematics course and placed in a remedial class. A study about the correlation between the placement scores and the final course grade is being written and the placement test scores and final grades for a group of students who took the regular course were recorded as follows: Placement Course Test Grade 50 53 35 41 35 61 40 56 55 68 65 36 35 11 60 70 90 79 35 59 90 54 80 91 60 48 60 71 60 40 55 50 65 50 79 Plot a scatter diagram of the data. Compute for the correlation coefficient and interpret the result. (Write your interpretation in statement form) ||4|3|6|5| 71 47 68 57

Glencoe Algebra 1, Student Edition, 9780079039897, 0079039898, 2018
18th Edition
ISBN:9780079039897
Author:Carter
Publisher:Carter
Chapter10: Statistics
Section10.6: Summarizing Categorical Data
Problem 23PPS

Related questions
Question
Follow the instructions. Typewritten for an upvote. No upvote for handwritten. PLEASE SKIP IF YOU HAVE ALREADY DONE THIS. Thank you
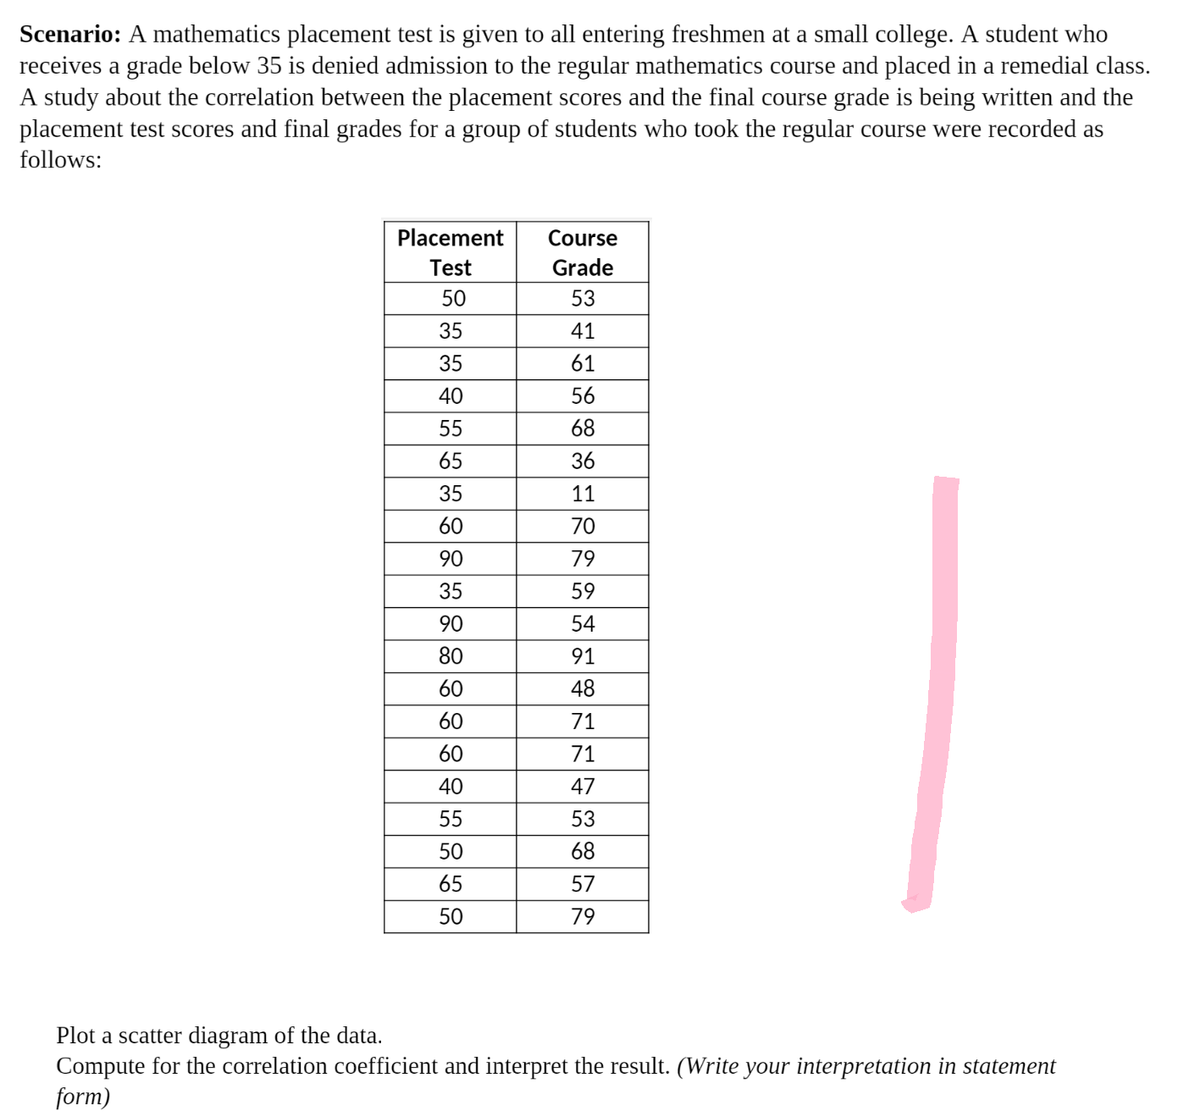
Transcribed Image Text:Scenario: A mathematics placement test is given to all entering freshmen at a small college. A student who
receives a grade below 35 is denied admission to the regular mathematics course and placed in a remedial class.
A study about the correlation between the placement scores and the final course grade is being written and the
placement test scores and final grades for a group of students who took the regular course were recorded as
follows:
Placement
Course
Test
Grade
50
53
35
41
35
61
40
56
55
68
65
36
35
11
60
70
90
79
35
59
90
54
80
91
60
48
60
71
60
71
40
47
55
53
50
68
65
57
50
79
Plot a scatter diagram of the data.
Compute for the correlation coefficient and interpret the result. (Write your interpretation in statement
form)
Expert Solution
This question has been solved!
Explore an expertly crafted, step-by-step solution for a thorough understanding of key concepts.

This is a popular solution!

Trending now
This is a popular solution!

Step by step
Solved in 4 steps with 5 images

Recommended textbooks for you
Glencoe Algebra 1, Student Edition, 9780079039897…
Algebra
ISBN:
9780079039897
Author:
Carter
Publisher:
McGraw Hill

Big Ideas Math A Bridge To Success Algebra 1: Stu…
Algebra
ISBN:
9781680331141
Author:
HOUGHTON MIFFLIN HARCOURT
Publisher:
Houghton Mifflin Harcourt

Holt Mcdougal Larson Pre-algebra: Student Edition…
Algebra
ISBN:
9780547587776
Author:
HOLT MCDOUGAL
Publisher:
HOLT MCDOUGAL
Glencoe Algebra 1, Student Edition, 9780079039897…
Algebra
ISBN:
9780079039897
Author:
Carter
Publisher:
McGraw Hill
Big Ideas Math A Bridge To Success Algebra 1: Stu…
Algebra
ISBN:
9781680331141
Author:
HOUGHTON MIFFLIN HARCOURT
Publisher:
Houghton Mifflin Harcourt
Holt Mcdougal Larson Pre-algebra: Student Edition…
Algebra
ISBN:
9780547587776
Author:
HOLT MCDOUGAL
Publisher:
HOLT MCDOUGAL