Please interpret the given Multiple comparison/LSD table from the
Q: A study compared three display panels used by air traffic controllers. Each display panel was tested…
A: Since we only answer up to 3 sub-parts, we’ll answer the first 3. Please resubmit the question and…
Q: "old stayers", only 20% have a high school degree. What is the "age-standardized" proportion of…
A:
Q: The number of computers sold per day at a local computer store, along with its corresponding…
A: From the above data x P(X) X*P(X) X-µ (X-µ)2 (X-µ)2 *P(X) 0 0.1 0 -2.2 4.84 0.484 1 0.2…
Q: Years Sales 1 80 3 97 4 92 4 102 6 103 8 111 10 119 10 123 11 117 13 136
A: Regression is an inferential statistical procedure.
Q: of Individuals 140 120 100 60 60 40 20- 160 170 150 190 200 Body Mass (a) 210 220 230
A:
Q: Research was conducted on the amount of training for 5K and the time a contestant took to run the…
A: “Since you have posted a question with multiple sub-parts, we will solve the first three sub-parts…
Q: i.i.d. X₁,..., X d. N(0,0²) where both 0 and ² unknown. Between Ho00o and H₁ : 0 > 00. Specify and…
A:
Q: The Smoky Bear Trucking Company claims that the average weight of a fully loaded moving van is no…
A:
Q: Suppose there exists a population where 60% of its members possess a certain characteristic. Let be…
A:
Q: In a study to investigate whether women are really more talkative than men, the difference in the…
A: The question is based on paired t test Given : No. of randomly selected couples ( n ) = 56 ∑i=156 di…
Q: P(Z is less than -2.11) = [Select] P(Z is between -2.11 and 3.1) = [Select] < <
A: It is given that Z be a standard normal random variable with mean 0 and standard deviation 1.
Q: The data below represent the responses to two questions asked in a survey of 40 college students…
A: The question is about representation of data in contingency table format Given :
Q: A poll of a registered voters is a small town is taken to determine their preferences in the…
A:
Q: The random sample shown below was selected from a normal distribution. 5, 10, 4, 5, 3, 9…
A:
Q: For a population of N=906,starting from row 03 and column 01 of the accompanying table of random…
A: Given information: Population size, N = 906 Sample size, n = 10
Q: You generate a scatter plot using Excel. You then have Excel plot the trend line and report the…
A:
Q: A box contains 4 red, 3 white and 2 blue balls. Three balls are drawn at random. Find out the number…
A: Given Box contain 4 red, 3 white and 2 blue balls Total no. of balls=9 Three balls are drawn at…
Q: researcher is interested to see if having a college degree results in higher incomes. She knows the…
A: Given
Q: Given a random variable Z with a standard normal distribution, calculate the following probabilitie…
A: Given that The random variable Z follow a standard normal distribution. P(Z is less than -2.11)…
Q: create a hypothesis and understand the graphs for example.. from a diffrent project seen in the…
A: In the given analysis, a One way ANOVA is used to analyze whether the averages of fish caught in…
Q: How do the average credit scores of people living in different cities differ? The data in the…
A: The data set shows the average credit scores of 47 cities.
Q: What's the temperature? The temperature in a certain location was recorded each day for two months.…
A: Consider that a random variable X has expected value μ and standard deviation, σ. Now, according to…
Q: Instruction. Use Microsoft Excel in computing the following problems. Show screenshots of your…
A: The mean is 25 and the standard deviation is 9.
Q: The data below represent the responses to two questions asked in a survey of 40 college students…
A: The contingency table represents two classifications of a set of counts or frequencies. The rows…
Q: Answer the following probability questions: What is the probability that an even number appears on…
A: “Since you have asked multiple questions, we will solve the first question for you. If you want any…
Q: accounting firm annually monitors a certain mailing service's performance. One parameter of…
A:
Q: Last year, a person wrote 116 checks. Let the random variable x represent the number of checks he…
A:
Q: The distribution below is… Perfectly normally distributed
A: We know that The peak is at the middle and represent symmetric distribution then it is normal…
Q: The following three independent random samples are obtained from three normally distributed…
A: For the given data Perform Anova one way
Q: Q1: A craftsman has three identical boxes, each with two identical drawers. In the first box, one…
A: Let A1, A2, ... , An be n mutually exclusive and exhaustive events with P(Ai) > 0 for all i = 1,…
Q: I want to explain these tables and output
A: Understanding the Tables: The table represents the number of valid observations taken into analysis…
Q: II. Choose the letter that corresponds to the correct answer in the given box below. 13. What is the…
A: Since we only do up to three sub parts of a problem, we'll be doing the first three sub parts only.…
Q: How many samples are possible of size 3 taken from the population 1, 2, 3, 5, 6 and 8? D. 35 A. 20…
A: It is given that Sample size n = 3 Population size N = 6 Note : Since you have asked multiple…
Q: Report the equation of the best-fit straight line, using weight as the predictor (x) and cost as…
A: Regression equation is used in forecasting.
Q: Properties of Central *_t_* nd non central _*t*_ distribution
A:
Q: Given the interval estimate for the mean (9.4, 11), the point estimate for the mean is and the…
A: The confidence interval is (9.4, 11).
Q: A bag comes in 4 styles and each style comes in 5 different colors. How many different bags are…
A: The answer is explained below,
Q: A consumer information website tracks automobile complaints. Their report contains consumer vehicle…
A: Given : Complaints by automaker Complaints by category
Q: Determine whether the samples are independent or related. 2. A company involved in a large volume…
A: A company involved in a large volume of business by mail decides to test whether there is a…
Q: A research finds that the more couples argue, the less intimate they tend to feel towards each…
A: From the above data We are given that A research finds that the more couples argue, the less…
Q: You may need to use the appropriate appendix table or technology to answer this question. Given are…
A: Given information: X Y 3 55 12 40 6 55 20 10 14 15
Q: Question 5, 5.2.17-T HW Score: 28.57%, 4 of 14 points multipl View an example | All parts showing…
A:
Q: When computing a 95 percent confidence interval for a with a sample of 30, what values of g would we…
A: The chi-square statistic is used to determine the critical values for the confidence intervals for…
Q: Independent random samples from normal populations produced the results shown in the table to the…
A: Given n1=5 n2=4
Q: Grades A Midterm 91 Final 93 SELECTED MALE STUDENTS IN CALCULUS B C D E F G 86 91 89 92 86 81 89 93…
A: Pearson correlation coefficient, and Spearman's rho are parametric and non parametric measures of…
Q: 1. a. The profits (in lakhs of rupees) of 20 companies for the year 2000-2009 are given below: 20,…
A: Solution-: Given data: Profit (in lakhs of rupees )…
Q: 5: Use the quadratic interpolation and the following data to find f(1.4) X 1 1.2 1.3 1.4 1.5 F(x)…
A:
Q: 1. Suppose you asked a sample of 12 correctional officers for the number of serious injuries they…
A:
Q: A researcher wants to estimate the average number of hours students spend in social media in a day.…
A: Given Standard deviations=45 Margin of error=5 Z=1.645
Q: 1. An article in the Journal of the American Statistical Association ["Markov Chain Monte Carlo…
A:
Please interpret the given Multiple comparison/LSD table from the attached photo below.
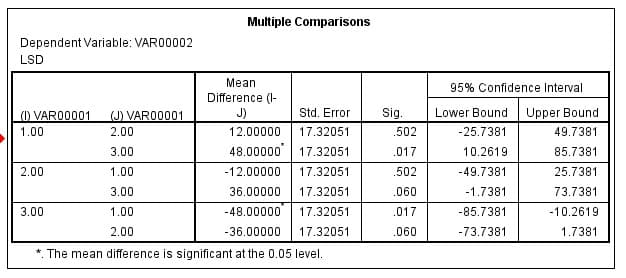
Step by step
Solved in 2 steps
- Using a long rod that has length m, you are goingto lay out a square plot in which the length of eachside is m. Thus the area of the plot will be m2.However, you do not know the value of m, soyou decide to make n independent measurementsX1, X2,... Xn of the length. Assume that each Xihas mean m (unbiased measurements) and variance s2.a. Show that X2 is not an unbiased estimatorfor m2. [Hint: For any rv Y, E(Y2) ¼V(Y) + [E(Y)]2. Apply this with Y ¼ X.]b. For what value of k is the estimator X2 - kS2unbiased for m2? [Hint: Compute E(X2 - kS2).]How many levels or categories does a study have if using a goodness of fit test and reporting a df=2 A study using the chi-square test of independence has 4 categories of one variables and 2 categories for its other variable. What are the degrees of freedom for the study? If a chi-square test of Independence ends in a non-significant result it means that the variables depend on each other. True Falsecomparison of the precisions of two machines developed for extracting juice from oranges is to be made using the following data. Is there sufficient evidence to indicate that there is a difference in the precision of the two machines at the 5% level of significance? Machine A Machine B s2 = 1.4 ounces2 s2 = 3.1 ounces2 n=25 n=20
- Having the variation data regression line r=0.931 and the calculated coefficient of determination of 0.867.. And explained variation of the data of 86.7%.. About the unexplained variation? [ ] % of the variation is unexplained and is due to other factors or to sampling error. (Round to one decimal place as needed.)The director of research and development is testing a new drug. She wants to know if there is evidence at the 0.02 level that the drug stays in the system for more than 312 minutes. For a sample of 69 patients, the mean time the drug stayed in the system was 319 minutes. Assume the variance is known to be 400. Enter the decision rule. Reject Ho if z >_______True or False If the comparison wise type I error is set at 0.05, then the experiment wise type I error is equal to or Greater than 0.05
- Getting an adequate amount of sleep can improve a variety of physiological functions, and it is known that the average number of hours that people sleep each night is normally distributed. A psychiatrist or a major research center takes an SRS of 25 emotionally disturbed patients and records the average amount of sleep that each gets on a typical night. He summarizes the data and finds that Xbar=6.90 and S= 0.878. What sample size would the researcher need to use in order to decrease the margin of error of a 95% confidence interval to +-0.20 hours?Q2 Based on your graphical and numerical analysis in Q1, which method - 1.5(IQR) or 3(SD) is more appropriate to remove outliers from the departure delay variable? Remove outliers for departure delay with the appropriate method. Store this new dataset as 'no_out_dd. You'll want to use this new dataset without outliers for use in Q3. What proportion of rows remains following the removal process multiple times. Can you please show how to do this in R Studio?A small college is concerned that their online classes are less successful than their face-toface classes. To test this claim, the college randomly selects students from their online and face-to-face classes, gathers their average grades, and finds the summary statistics in the table below. Does the information below suggest the online classes are not performing as well as the face-to-face classes at this small college? (Assume that the assumptions and conditions for comparing two means have been satisfied, use � = 0.01) Online Grades Face to Face Grades MEAN (x) 75.2 74.8 SD (s) 3.99 4.32 COUNT (n) 27 29
- A survey was conducted to study the height of people from IBRI and NIZWA. The results are shown here. The researcher is interested to examine is there a significant difference between the average height of people of the two places at a=0.05. Write the hypothesis and evaluate t-test value only. [Assuming the population variances are equal and use 2-decimal places].A political consultant wants to sample the inhabitants of a county to estimate what proportion of all the inhabitants of the county support a certain candidate. You want to use the sampled data to construct an interval from a sample based on z-scores for the proportion, and you are considering two sample sizes: a large sample of n = 900 for more accurate results and a small sample of n = 100 to save time and money. Assuming that the sample proportion is the same in each sample, what is true about the margins of error for these two samples? The smaller sample margin of error will be approximately (select one) the larger sample margin of error. 1/9 1/3 Same as 3 times 9 timesUsing a long rod that has length μ, you are going to lay out a square plot in which the length of each side is μ. Thus the area of the plot will be μ2 However, you do not know the value of μ, so you decide to make n independent measurements X1, X2,..., Xn of the length.Assume that each Xi has mean μ (unbiased measurements) and variance σ2.