Scenario: A pediatrician wants to determine the relation that may exist between a child's height and head circumference. She randomly selects eleven 3-year old children from her practice, measures their heights and head circumference, and obtains the data shown below: Height (inches) Head Circumference (inches) 27.75 17.5 24.5 17.1 25.5 17.1 26 17.3 25 16.9 25.75 17.6 26.5 17.3 27 17.5 26.75 17.3 26.75 17.5 27.5 17.5 a. If the pediatrician wants to use height to predict head circumference, determine which variable is the explanatory variable and which is response variable. b. Draw a scatter diagram of the data. c. Draw the best fit line on the scatter diagram. d. Does this scatter diagram show a positive, negative, or no relationship between a child's height and the head circumference?
Scenario: A pediatrician wants to determine the relation that may exist between a child's height and head circumference. She randomly selects eleven 3-year old children from her practice, measures their heights and head circumference, and obtains the data shown below: Height (inches) Head Circumference (inches) 27.75 17.5 24.5 17.1 25.5 17.1 26 17.3 25 16.9 25.75 17.6 26.5 17.3 27 17.5 26.75 17.3 26.75 17.5 27.5 17.5 a. If the pediatrician wants to use height to predict head circumference, determine which variable is the explanatory variable and which is response variable. b. Draw a scatter diagram of the data. c. Draw the best fit line on the scatter diagram. d. Does this scatter diagram show a positive, negative, or no relationship between a child's height and the head circumference?

Algebra & Trigonometry with Analytic Geometry
13th Edition
ISBN:9781133382119
Author:Swokowski
Publisher:Swokowski
Chapter7: Analytic Trigonometry
Section7.6: The Inverse Trigonometric Functions
Problem 94E

Related questions
Topic Video
Question
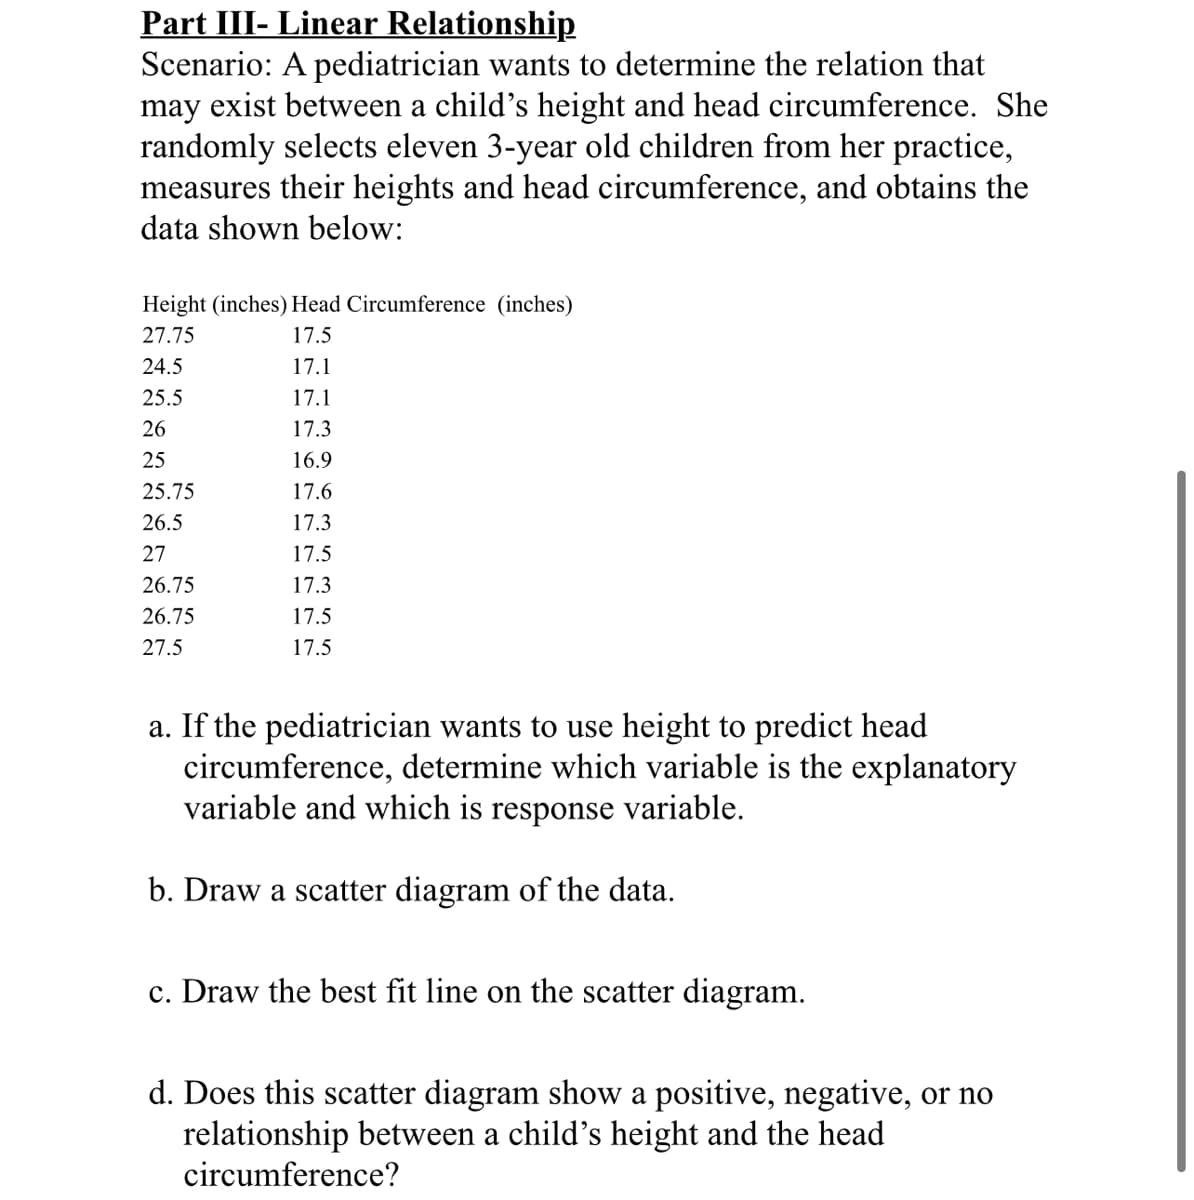
Transcribed Image Text:Part III- Linear Relationship
Scenario: A pediatrician wants to determine the relation that
may exist between a child's height and head circumference. She
randomly selects eleven 3-year old children from her practice,
measures their heights and head circumference, and obtains the
data shown below:
Height (inches) Head Circumference (inches)
27.75
17.5
24.5
17.1
25.5
17.1
26
17.3
25
16.9
25.75
17.6
26.5
17.3
27
17.5
26.75
17.3
26.75
17.5
27.5
17.5
a. If the pediatrician wants to use height to predict head
circumference, determine which variable is the explanatory
variable and which is response variable.
b. Draw a scatter diagram of the data.
c. Draw the best fit line on the scatter diagram.
d. Does this scatter diagram show a positive, negative, or no
relationship between a child's height and the head
circumference?
Expert Solution
This question has been solved!
Explore an expertly crafted, step-by-step solution for a thorough understanding of key concepts.

This is a popular solution!

Trending now
This is a popular solution!

Step by step
Solved in 4 steps with 2 images

Knowledge Booster


Learn more about
Need a deep-dive on the concept behind this application? Look no further. Learn more about this topic, statistics and related others by exploring similar questions and additional content below.Recommended textbooks for you
Algebra & Trigonometry with Analytic Geometry
Algebra
ISBN:
9781133382119
Author:
Swokowski
Publisher:
Cengage

Glencoe Algebra 1, Student Edition, 9780079039897…
Algebra
ISBN:
9780079039897
Author:
Carter
Publisher:
McGraw Hill
Algebra & Trigonometry with Analytic Geometry
Algebra
ISBN:
9781133382119
Author:
Swokowski
Publisher:
Cengage
Glencoe Algebra 1, Student Edition, 9780079039897…
Algebra
ISBN:
9780079039897
Author:
Carter
Publisher:
McGraw Hill