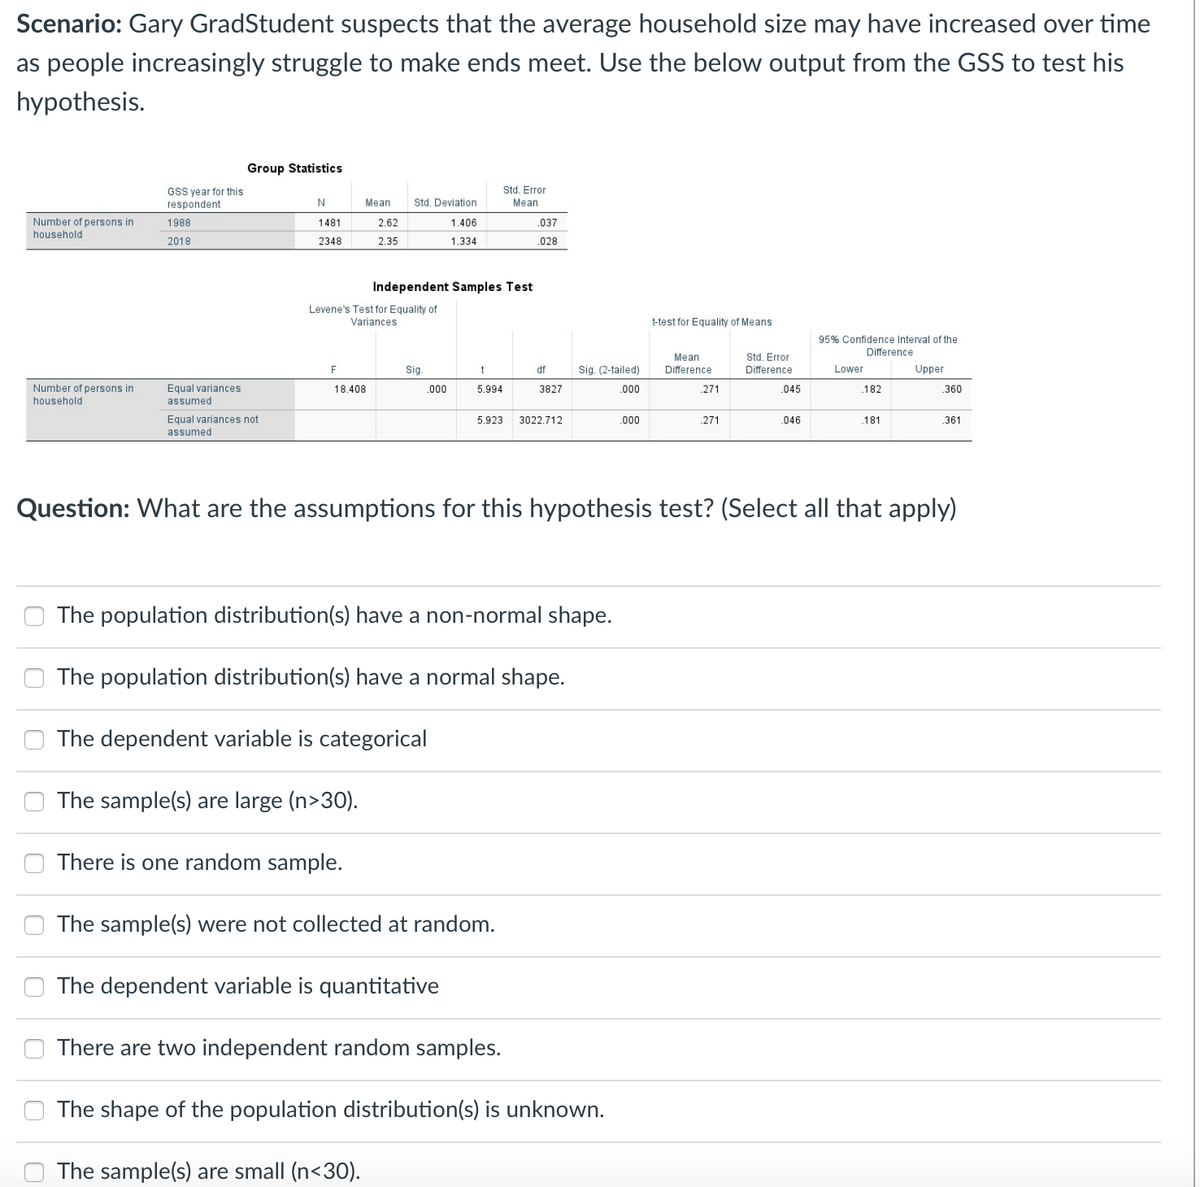
Scenario: Gary GradStudent suspects that the average household size may have increased over time as people increasingly struggle to make ends meet. Use the below output from the GSS to test his hypothesis. Group Statistics GSS year for this Std. Error respondent Mean Std. Deviation Mean Number of persons in 1988 1481 2.62 1.406 .037 household 2018 2348 2.35 1.334 .028 Independent Samples Test Levene's Test for Equality of Variances t-test for Equality of Means 95% Confidence Interval of the Difference Std. Error Difference Mean F Si. df Sig. (2-tailed) Difference Lower Upper Equal variances Number of persons in household 18.408 .000 5.994 3827 .000 271 .045 .182 360 assumed Equal variances not assumed 5.923 3022.712 .000 .271 .046 .181 .361 Question: What are the assumptions for this hypothesis test? (Select all that apply) The population distribution(s) have a non-normal shape. The population distribution(s) have a normal shape. The dependent variable is categorical The sample(s) are large (n>30). There is one random sample. The sample(s) were not collected at random. The dependent variable is quantitative There are two independent random samples. The shape of the population distribution(s) is unknown. The sample(s) are small (n<30).
Scenario: Gary GradStudent suspects that the average household size may have increased over time as people increasingly struggle to make ends meet. Use the below output from the GSS to test his hypothesis. Group Statistics GSS year for this Std. Error respondent Mean Std. Deviation Mean Number of persons in 1988 1481 2.62 1.406 .037 household 2018 2348 2.35 1.334 .028 Independent Samples Test Levene's Test for Equality of Variances t-test for Equality of Means 95% Confidence Interval of the Difference Std. Error Difference Mean F Si. df Sig. (2-tailed) Difference Lower Upper Equal variances Number of persons in household 18.408 .000 5.994 3827 .000 271 .045 .182 360 assumed Equal variances not assumed 5.923 3022.712 .000 .271 .046 .181 .361 Question: What are the assumptions for this hypothesis test? (Select all that apply) The population distribution(s) have a non-normal shape. The population distribution(s) have a normal shape. The dependent variable is categorical The sample(s) are large (n>30). There is one random sample. The sample(s) were not collected at random. The dependent variable is quantitative There are two independent random samples. The shape of the population distribution(s) is unknown. The sample(s) are small (n<30).

Linear Algebra: A Modern Introduction
4th Edition
ISBN:9781285463247
Author:David Poole
Publisher:David Poole
Chapter7: Distance And Approximation
Section7.3: Least Squares Approximation
Problem 31EQ

Related questions
Question
Transcribed Image Text:Scenario: Gary GradStudent suspects that the average household size may have increased over time
as people increasingly struggle to make ends meet. Use the below output from the GSS to test his
hypothesis.
Group Statistics
GSS year for this
Std. Error
respondent
Mean
Std. Deviation
Mean
Number of persons in
household
1988
1481
2.62
1.406
,037
2018
2348
2.35
1.334
.028
Independent Samples Test
Levene's Test for Equality of
Variances
t-test for Equality of Means
95% Confidence Interval of the
Difference
Mean
Std. Error
F
Sig.
t
df
Sig. (2-tailed)
Difference
Difference
Lower
Upper
Number of persons in
Equal variances
18.408
.000
5.994
3827
.000
271
.045
.182
.360
household
assumed
Equal variances not
5.923
3022.712
.000
.271
.046
.181
361
assumed
Question: What are the assumptions for this hypothesis test? (Select all that apply)
The population distribution(s) have a non-normal shape.
The population distribution(s) have a normal shape.
The dependent variable is categorical
The sample(s) are large (n>30).
There is one random sample.
The sample(s) were not collected at random.
The dependent variable is quantitative
There are two independent random samples.
The shape of the population distribution(s) is unknown.
The sample(s) are small (n<30).
O O 0 00
Expert Solution
This question has been solved!
Explore an expertly crafted, step-by-step solution for a thorough understanding of key concepts.

Step by step
Solved in 2 steps

Recommended textbooks for you
Linear Algebra: A Modern Introduction
Algebra
ISBN:
9781285463247
Author:
David Poole
Publisher:
Cengage Learning
Linear Algebra: A Modern Introduction
Algebra
ISBN:
9781285463247
Author:
David Poole
Publisher:
Cengage Learning