4) the accompanying dataset provides data on monthly unemployment rates for a certain region over four years. Compare 3- and 12- month moving average forecast using the MAD criterion. Which of the two models yields better results? (See picture) Find the MAD for the 3 month moving average forcast. MAD = _____
4) the accompanying dataset provides data on monthly unemployment rates for a certain region over four years. Compare 3- and 12- month moving average forecast using the MAD criterion. Which of the two models yields better results? (See picture) Find the MAD for the 3 month moving average forcast. MAD = _____

Holt Mcdougal Larson Pre-algebra: Student Edition 2012
1st Edition
ISBN:9780547587776
Author:HOLT MCDOUGAL
Publisher:HOLT MCDOUGAL
Chapter11: Data Analysis And Probability
Section11.4: Collecting Data
Problem 2E

Related questions
Question
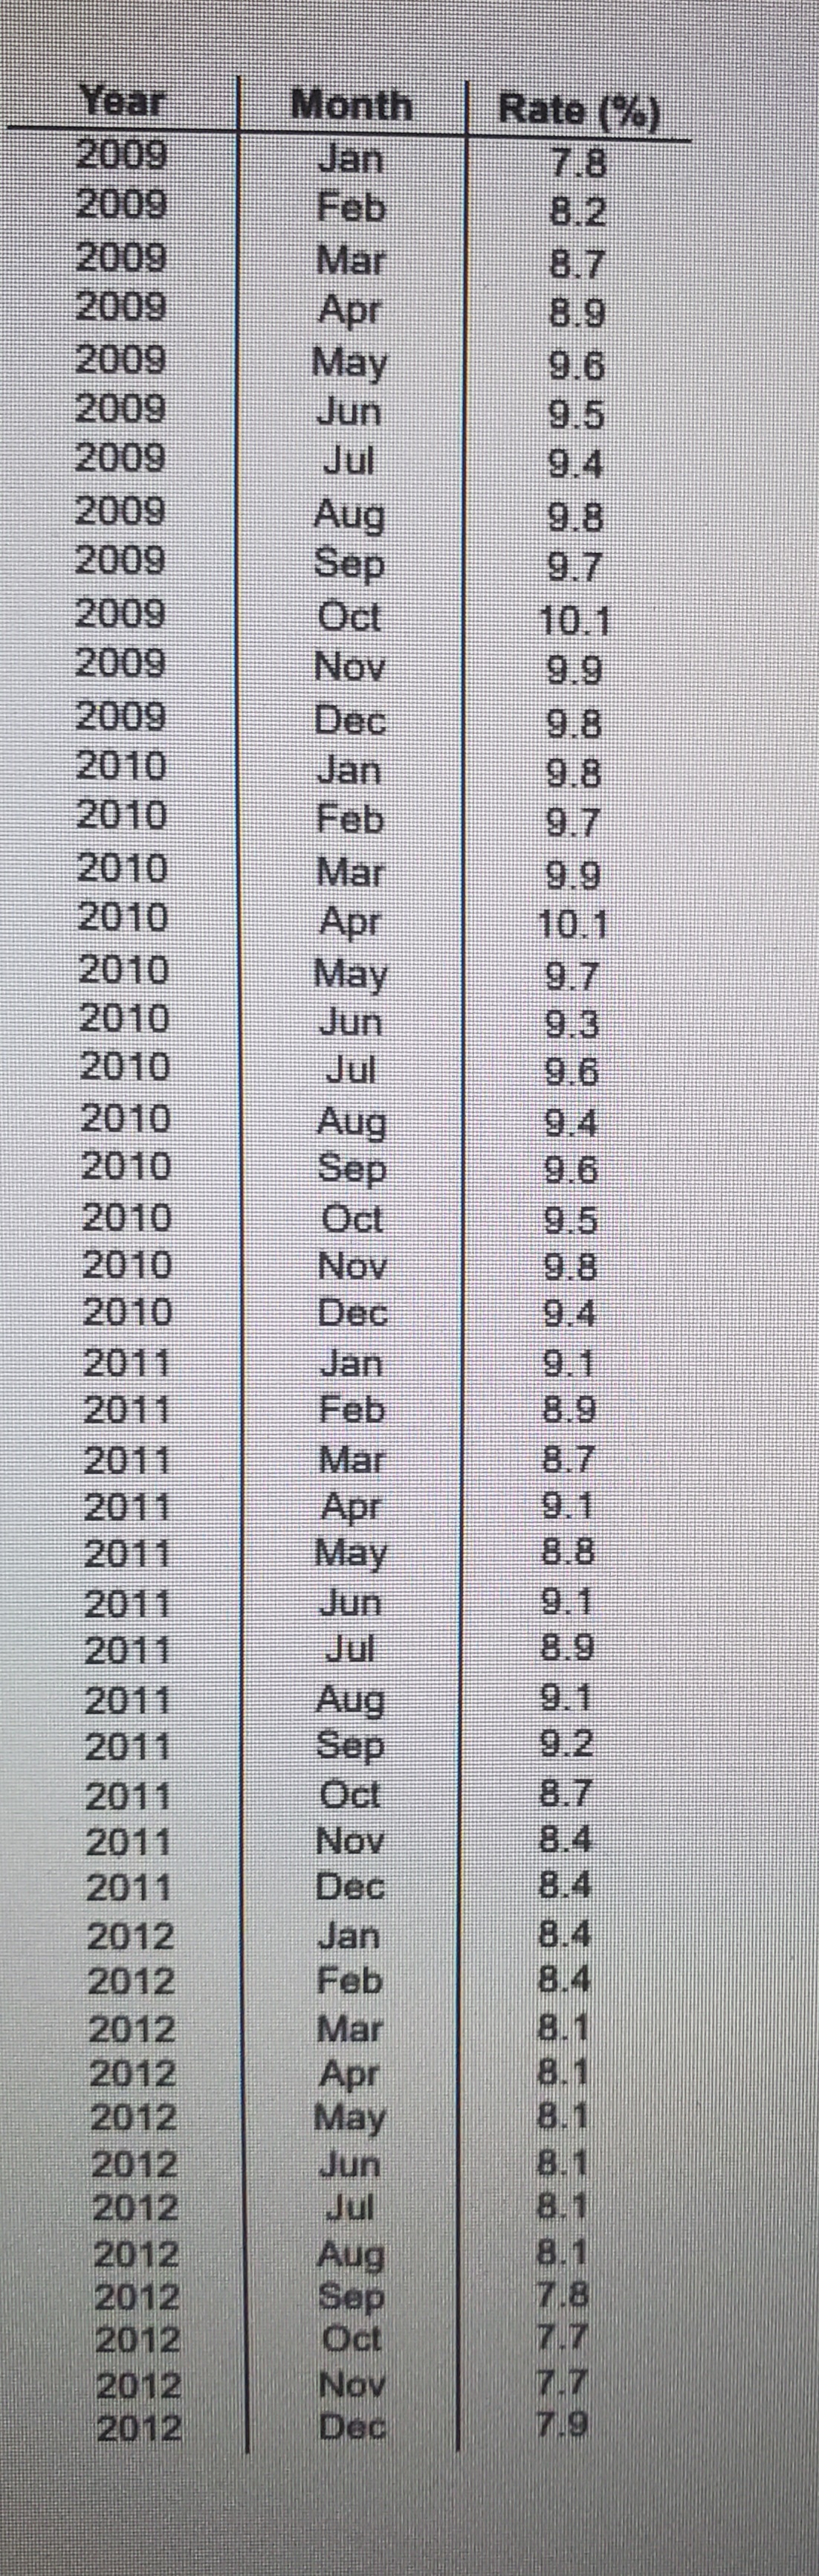
4) the accompanying dataset provides data on monthly unemployment rates for a certain region over four years. Compare 3- and 12- month moving average forecast using the MAD criterion. Which of the two models yields better results? (See picture)
Find the MAD for the 3 month moving average forcast.
MAD = _____
Transcribed Image Text:Year
2009
2009
Month
Jan
Feb
Mar
Apr
May
Rate (%)
7.8
8.2
8.7
8.9
2009
2009
2009
2009
9.6
9.5
Jun
2009
2009
2009
2009
2009
2009
2010
2010
2010
2010
Jul
9.4
Aug
Sep
Ocl
Nov
Dec
Jan
Feb
Mar
Apr
May
Jun
9.7
10.1
9.9
9.8
9.8
9.7
2010
2010
2010
2010
2010
9.9
10.1
9.7
9.3
9.6
Jul
Aug
Sep
Oct
Nov
Dec
9.4
9.6
2010
9.5
2010
2010
2011
2011
9.8
9.4
Jan
Feb
Mar
Apr
May
9.1
8.9
2011
8.7
9.1
8.8
9.1
8.9
2011
2011
2011
2011
Jun
Jul
Aug
Sep
Oct
9.1
9.2
8.7
2011
2011
2011
2011
2011
Nov
Dec
8.4
8.4
8.4
8.4
8.1
8.1
8.1
8.1
8.1
8.1
7.8
7.7
2012
Jan
2012
Feb
2012
2012
2012
Mar
Apr
May
Jun
Jul
2012
2012
2012
2012
2012
2012
2012
Aug
Sep
Oct
Nov
Dec
7.7
7.9
Expert Solution
This question has been solved!
Explore an expertly crafted, step-by-step solution for a thorough understanding of key concepts.

This is a popular solution!

Trending now
This is a popular solution!

Step by step
Solved in 7 steps

Knowledge Booster


Learn more about
Need a deep-dive on the concept behind this application? Look no further. Learn more about this topic, statistics and related others by exploring similar questions and additional content below.Recommended textbooks for you
Holt Mcdougal Larson Pre-algebra: Student Edition…
Algebra
ISBN:
9780547587776
Author:
HOLT MCDOUGAL
Publisher:
HOLT MCDOUGAL
Holt Mcdougal Larson Pre-algebra: Student Edition…
Algebra
ISBN:
9780547587776
Author:
HOLT MCDOUGAL
Publisher:
HOLT MCDOUGAL