Scenario Use the following information to answer questions 16-19. The graph below shows the market demand for computers in a small country. To develop a domestic computer industry, the government prohibits imports of computers and gives a single local firm the sole right to produce and sell computers (that is, it is a legal monopoly). The demand curve shows the local demand for computers. The cost curves show the marginal cost (MC) and average total cost (ATC) of the single producer. The graph also shows the marginal revenue (MR) curve faced by this firm. Price per computer (Dollars) $3500- $3000 $2500 $2000 $1500- $1000 $500 0 10 ..MC.. ATC MR Demand 20 30 40 50 60 70 Quantity of computers (number per year)
Scenario Use the following information to answer questions 16-19. The graph below shows the market demand for computers in a small country. To develop a domestic computer industry, the government prohibits imports of computers and gives a single local firm the sole right to produce and sell computers (that is, it is a legal monopoly). The demand curve shows the local demand for computers. The cost curves show the marginal cost (MC) and average total cost (ATC) of the single producer. The graph also shows the marginal revenue (MR) curve faced by this firm. Price per computer (Dollars) $3500- $3000 $2500 $2000 $1500- $1000 $500 0 10 ..MC.. ATC MR Demand 20 30 40 50 60 70 Quantity of computers (number per year)

Chapter2: Using Economics To Study Health Issues
Section: Chapter Questions
Problem 1QAP

Related questions
Question
Transcribed Image Text:Scenario
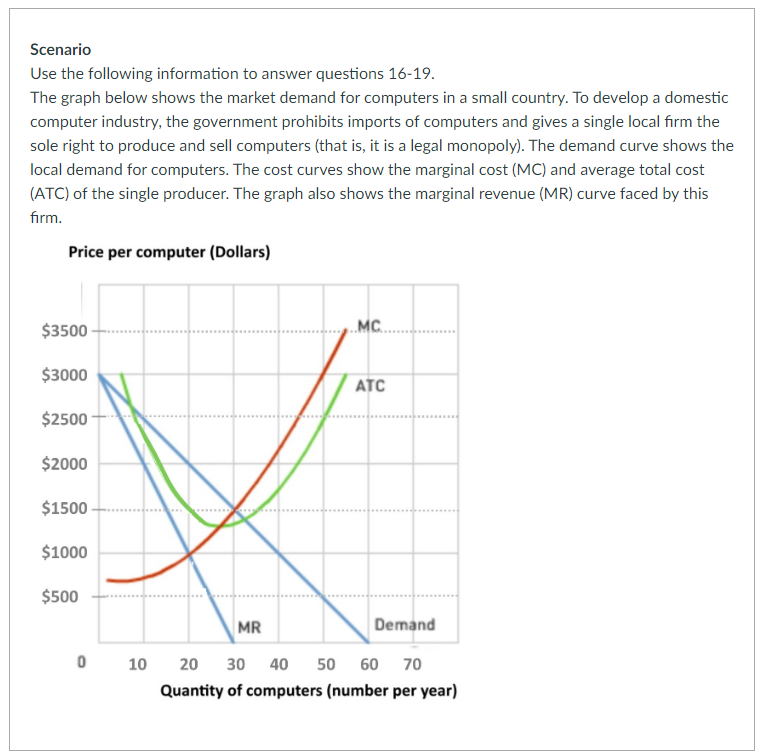
Use the following information to answer questions 16-19.
The graph below shows the market demand for computers in a small country. To develop a domestic
computer industry, the government prohibits imports of computers and gives a single local firm the
sole right to produce and sell computers (that is, it is a legal monopoly). The demand curve shows the
local demand for computers. The cost curves show the marginal cost (MC) and average total cost
(ATC) of the single producer. The graph also shows the marginal revenue (MR) curve faced by this
firm.
Price per computer (Dollars)
$3500
$3000
$2500
$2000
$1500
$1000
$500
0
MR
MC..
ATC
Demand
10 20 30 40 50 60 70
Quantity of computers (number per year)

Transcribed Image Text:How many computers will the monopolist sell to maximize profit?
Expert Solution
This question has been solved!
Explore an expertly crafted, step-by-step solution for a thorough understanding of key concepts.

This is a popular solution!

Trending now
This is a popular solution!

Step by step
Solved in 2 steps

Knowledge Booster


Learn more about
Need a deep-dive on the concept behind this application? Look no further. Learn more about this topic, economics and related others by exploring similar questions and additional content below.Recommended textbooks for you

Managerial Economics: Applications, Strategies an…
Economics
ISBN:
9781305506381
Author:
James R. McGuigan, R. Charles Moyer, Frederick H.deB. Harris
Publisher:
Cengage Learning
Managerial Economics: Applications, Strategies an…
Economics
ISBN:
9781305506381
Author:
James R. McGuigan, R. Charles Moyer, Frederick H.deB. Harris
Publisher:
Cengage Learning