The figure below shows the instrumental global surface temperature record since the late 19th centuries due to instrumental temperature record. Analyze the climate implication of the graph and 3 reasons for the trend in the graph.
The figure below shows the instrumental global surface temperature record since the late 19th centuries due to instrumental temperature record. Analyze the climate implication of the graph and 3 reasons for the trend in the graph.

Case Studies In Health Information Management
3rd Edition
ISBN:9781337676908
Author:SCHNERING
Publisher:SCHNERING
Chapter7: Healthcare Statistics And Research Methods
Section: Chapter Questions
Problem 7.19.2C

Related questions

Concept explainers
Population Growth
R and K Selection
R and K selection are concepts in ecology used to describe traits in the fluctuation of a population or population dynamics. For example, they describe the life-association traits between parent and offspring, such as quantity or number of young ones born at a time, quality of parental care, the age to maturity, and reproductive effort.
Question
Transcribed Image Text:The figure below shows the instrumental global surface temperature record since
the late 19th centuries due to instrumental temperature record. Analyze the climate
implication of the graph and 3 reasons for the trend in the graph.
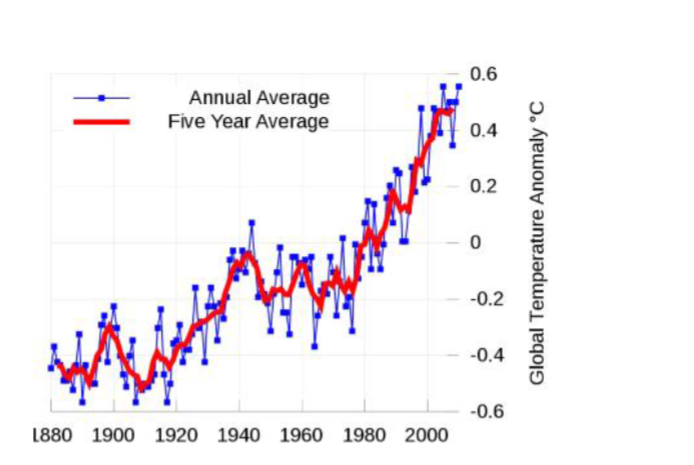
Transcribed Image Text:0.6
Annual Average
Five Year Average
0.4
0.2
-0.2
-0.4
-0.6
1880 1900 1920 1940 1960 1980 2000
Global Temperature Anomaly °C
Expert Solution
This question has been solved!
Explore an expertly crafted, step-by-step solution for a thorough understanding of key concepts.

Step by step
Solved in 2 steps

Knowledge Booster


Learn more about
Need a deep-dive on the concept behind this application? Look no further. Learn more about this topic, biology and related others by exploring similar questions and additional content below.Recommended textbooks for you
Case Studies In Health Information Management
Biology
ISBN:
9781337676908
Author:
SCHNERING
Publisher:
Cengage
Case Studies In Health Information Management
Biology
ISBN:
9781337676908
Author:
SCHNERING
Publisher:
Cengage