se open settings to verify your communication details. - PHS -- Lamothe, Kyle / Unit 3- Living Things 2.2, which has annual precipitation numbers in centimeters. Then compare them to the monthly precipitation numbers in the graph, which are in millimeters. It may be helpful to add up the graph numbers and convert that number to centimeters in order to determine the biome. Average temperatures are also represented on Fig. 2.2. 140 120 20 9 10 100 80 10 20 40 -30 20 40 month month b. City: Alice Springs, Australia Biome: desert tropical rain forest temperate grassland O tundra temperature (C) precipitation (mm)
se open settings to verify your communication details. - PHS -- Lamothe, Kyle / Unit 3- Living Things 2.2, which has annual precipitation numbers in centimeters. Then compare them to the monthly precipitation numbers in the graph, which are in millimeters. It may be helpful to add up the graph numbers and convert that number to centimeters in order to determine the biome. Average temperatures are also represented on Fig. 2.2. 140 120 20 9 10 100 80 10 20 40 -30 20 40 month month b. City: Alice Springs, Australia Biome: desert tropical rain forest temperate grassland O tundra temperature (C) precipitation (mm)

Chapter18: Vitamins, Minerals, And Herbals
Section: Chapter Questions
Problem 10RQ

Related questions
Question
Look at the following temperature and precipitation graph for a city around the world. Using this information, write down which biome each city has in it. Be careful to read the numbers along The numbers along the Y-axis carefully. For precipitation, you will need to look at figure 2.2, which has annual precipitation numbers in centimeters. Then compare them to the monthly precipitation numbers in the graph, which are in millimeters. It may be helpful to add up The graph numbers and convert that number to centimeters in order to determine the Biome. Average temperatures are also represented on figure 2.2.
Answer choices
A. Desert
B. Tropical rain forest
C. Temperate grassland
D. Tundra
Transcribed Image Text:se open settings to verify your communication details.
- PHS -- Lamothe, Kyle / Unit 3- Living Things
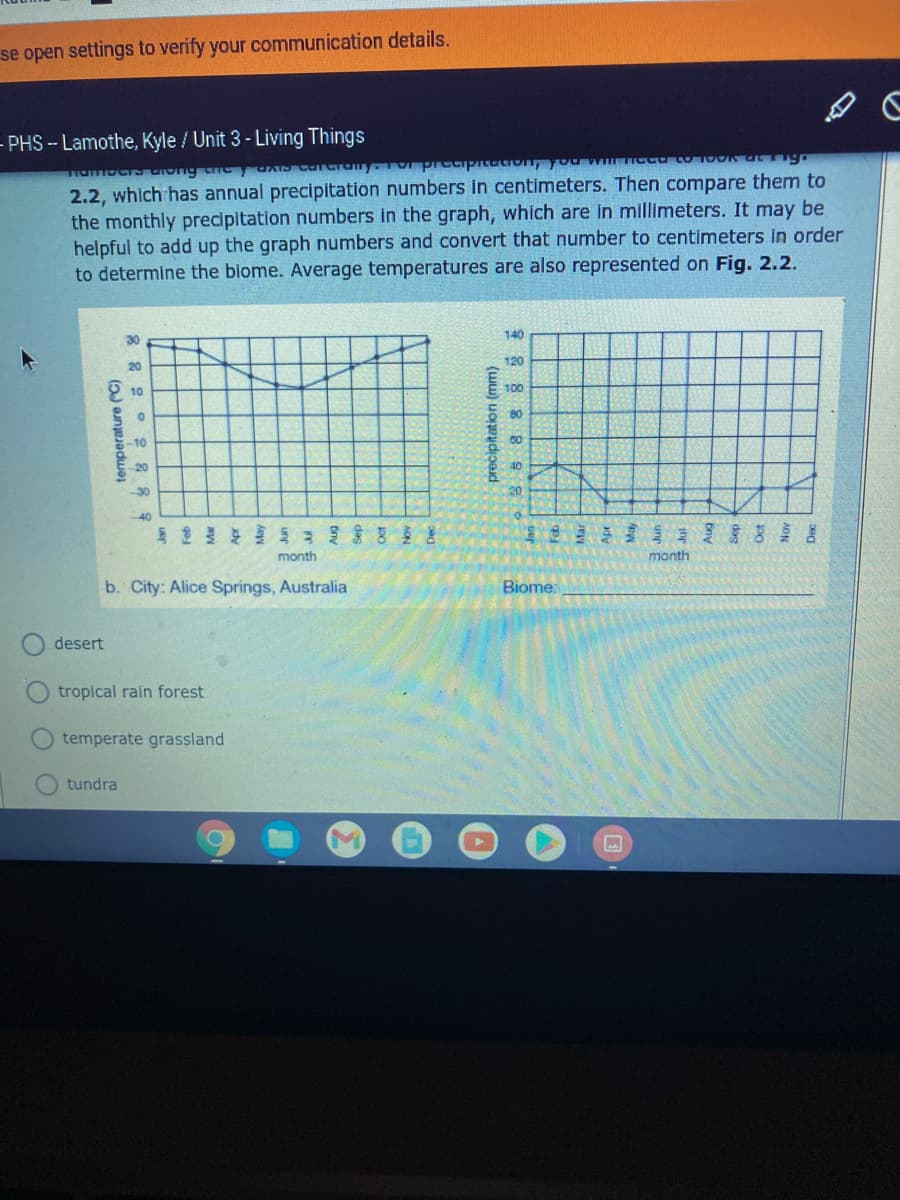
2.2, which has annual precipitation numbers in centimeters. Then compare them to
the monthly precipitation numbers in the graph, which are in millimeters. It may be
helpful to add up the graph numbers and convert that number to centimeters in order
to determine the blome. Average temperatures are also represented on Fig. 2.2.
140
30
120
20
10
100
80
-10
20
40
-30
20
40
S 吉昌
month
month
b. City: Alice Springs, Australia
Biome:
desert
tropical rain forest
temperate grassland
tundra
temperature ("C)
precipitation (mm)
Transcribed Image Text:99436/activity/2F895
rina -.
Isosceles Trapezoid.
U3L3 - E4 Flashcar.
open settings to verify your communication details.
HS--Lamothe, Kyle / Unit 3- Living Things
12) Choose the best answer.
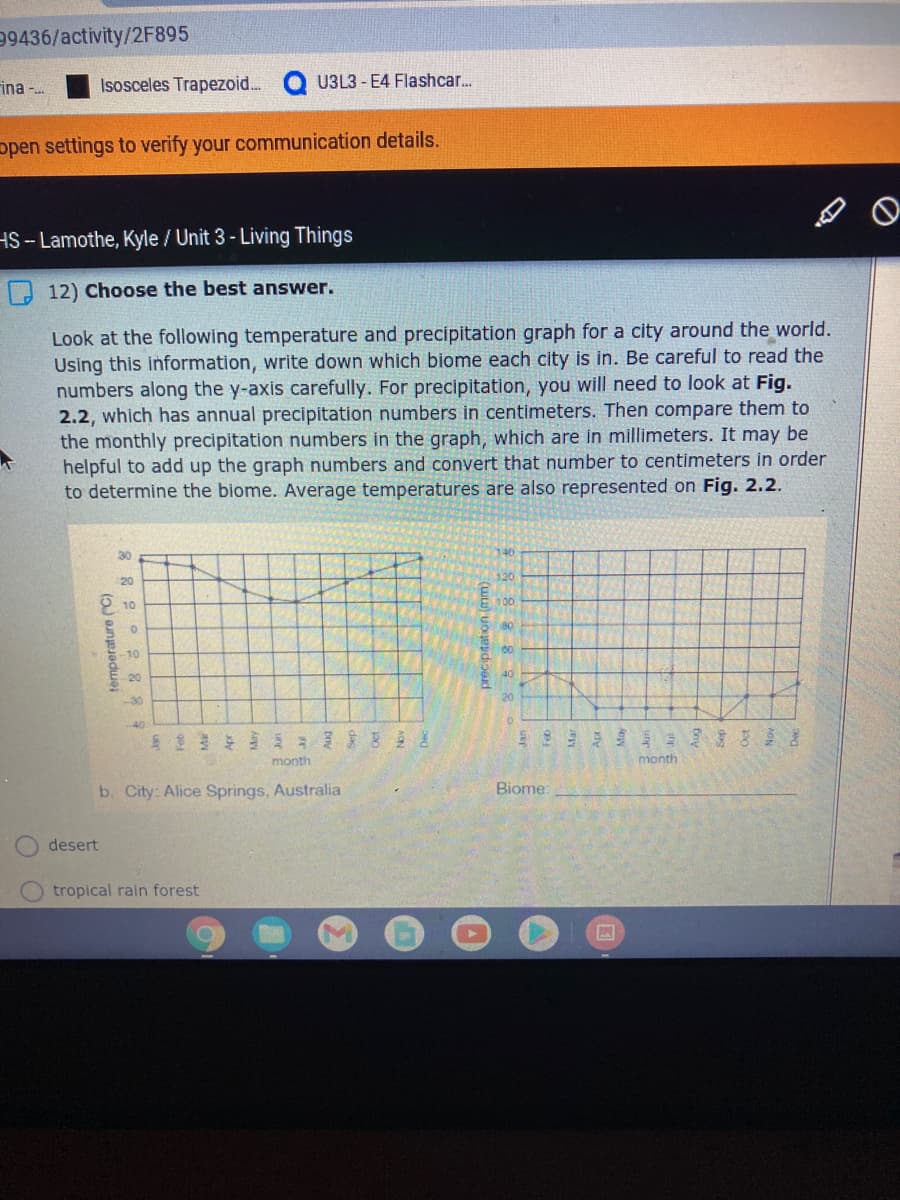
Look at the following temperature and precipitation graph for a city around the world.
Using this information, write down which biome each city is in. Be careful to read the
numbers along the y-axis carefully. For precipitation, you will need to look at Fig.
2.2, which has annual precipitation numbers in centimeters. Then compare them to
the monthly precipitation numbers in the graph, which are in millimeters. It may be
helpful to add up the graph numbers and convert that number to centimeters in order
to determine the biome. Average temperatures are also represented on Fig. 2.2.
30
120
20
10
100
80
10
-20
-30
23年3 ミ82差
month
month
b. City: Alice Springs, Australia
Biome:
desert
tropical rain forest
temperature (C)
orecipitation (mm)
Expert Solution
This question has been solved!
Explore an expertly crafted, step-by-step solution for a thorough understanding of key concepts.

This is a popular solution!

Trending now
This is a popular solution!

Step by step
Solved in 2 steps

Knowledge Booster


Learn more about
Need a deep-dive on the concept behind this application? Look no further. Learn more about this topic, biology and related others by exploring similar questions and additional content below.Recommended textbooks for you

Principles Of Radiographic Imaging: An Art And A …
Health & Nutrition
ISBN:
9781337711067
Author:
Richard R. Carlton, Arlene M. Adler, Vesna Balac
Publisher:
Cengage Learning
Principles Of Radiographic Imaging: An Art And A …
Health & Nutrition
ISBN:
9781337711067
Author:
Richard R. Carlton, Arlene M. Adler, Vesna Balac
Publisher:
Cengage Learning