Sean is hiking the Appalachinn Trail from Georgia to Maine. The distance of his hike is 2200 miles. It took Sean 134 days to complete the hike. The data below represent the distance, D, he had hiked t days after the start of his trip. 19 34 67 91 112 134 DO 308 578 1070 1715 1902 2200 1. Determine the linear regression equation for this data. Linear Regression Equation: D = Round to the nearest tenth as needed. 2. Interpret the meaning of the slope of this regression model. Sean hiked at a rate of approximately Select an answer v 3. Use your linear regression equation to estimate the total number of miles Sean had hiked in 63 days. Round your answer to the nearest mile. In 63 days, Sean had hiked miles. 4. Use your linear regression equation to estimate the total number of days it took for Sean to hike 309 miles. Round your answer to the nearest day. In days, Sean had hiked 309 miles.
Sean is hiking the Appalachinn Trail from Georgia to Maine. The distance of his hike is 2200 miles. It took Sean 134 days to complete the hike. The data below represent the distance, D, he had hiked t days after the start of his trip. 19 34 67 91 112 134 DO 308 578 1070 1715 1902 2200 1. Determine the linear regression equation for this data. Linear Regression Equation: D = Round to the nearest tenth as needed. 2. Interpret the meaning of the slope of this regression model. Sean hiked at a rate of approximately Select an answer v 3. Use your linear regression equation to estimate the total number of miles Sean had hiked in 63 days. Round your answer to the nearest mile. In 63 days, Sean had hiked miles. 4. Use your linear regression equation to estimate the total number of days it took for Sean to hike 309 miles. Round your answer to the nearest day. In days, Sean had hiked 309 miles.

Functions and Change: A Modeling Approach to College Algebra (MindTap Course List)
6th Edition
ISBN:9781337111348
Author:Bruce Crauder, Benny Evans, Alan Noell
Publisher:Bruce Crauder, Benny Evans, Alan Noell
Chapter3: Straight Lines And Linear Functions
Section3.CR: Chapter Review Exercises
Problem 16CR: XYZ Corporation Stock Prices The following table shows the average stock price, in dollars, of XYZ...

Related questions
Question
Transcribed Image Text:LINEAR REGRESSION
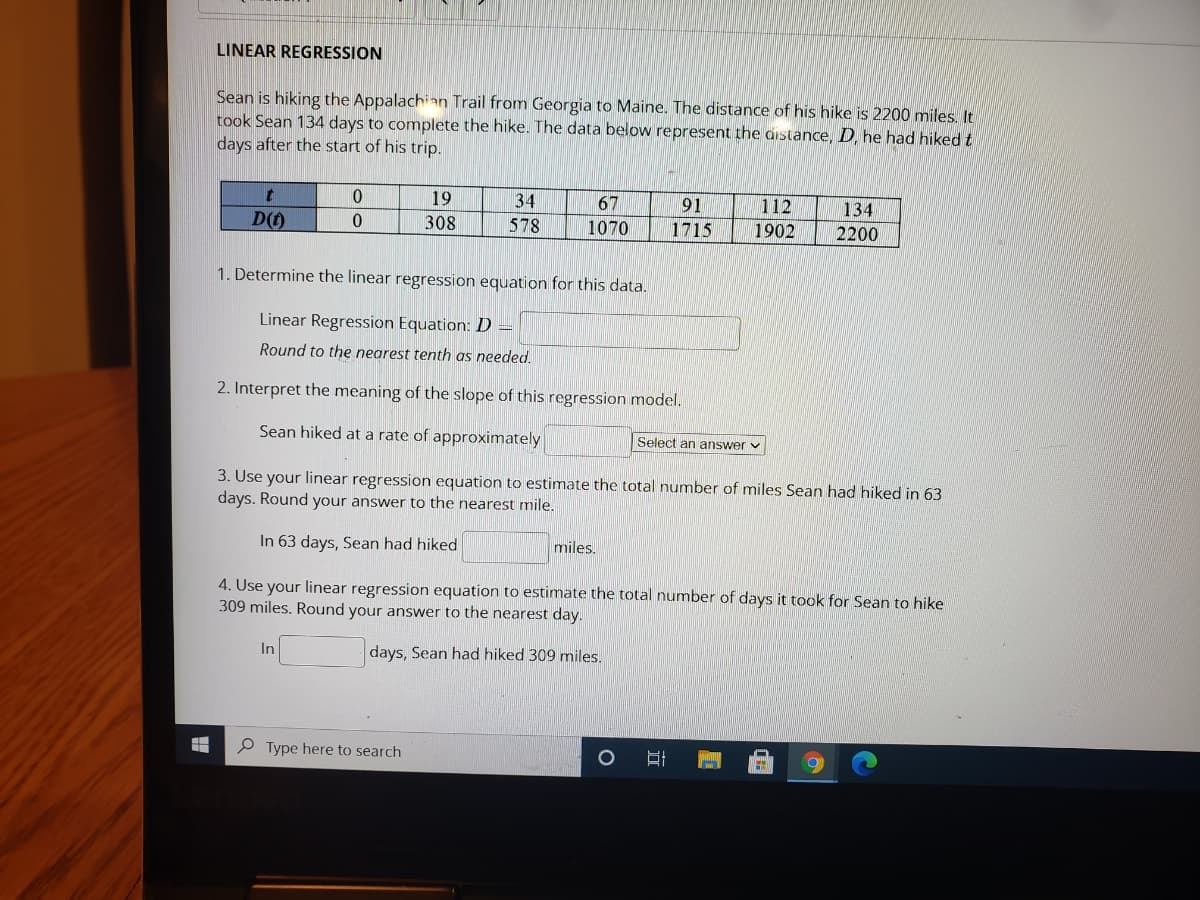
Sean is hiking the Appalachian Trail from Georgia to Maine. The distance of his hike is 2200 miles. It
took Sean 134 days to complete the hike. The data below represent the distance, D, he had hiked t
days after the start of his trip.
19
34
67
91
112
134
D()
308
578
1070
1715
1902
2200
1. Determine the linear regression equation for this data.
Linear Regression Equation: D =
Round to the nearest tenth as needed.
2. Interpret the meaning of the slope of this regression model.
Sean hiked at a rate of approximately
Select an answer v
3. Use your linear regression equation to estimate the total number of miles Sean had hiked in 63
days. Round your answer to the nearest mile.
In 63 days, Sean had hiked
miles.
4. Use your linear regression equation to estimate the total number of days it took for Sean to hike
309 miles. Round your answer to the nearest day.
In
days, Sean had hiked 309 mniles.
P Type here to search
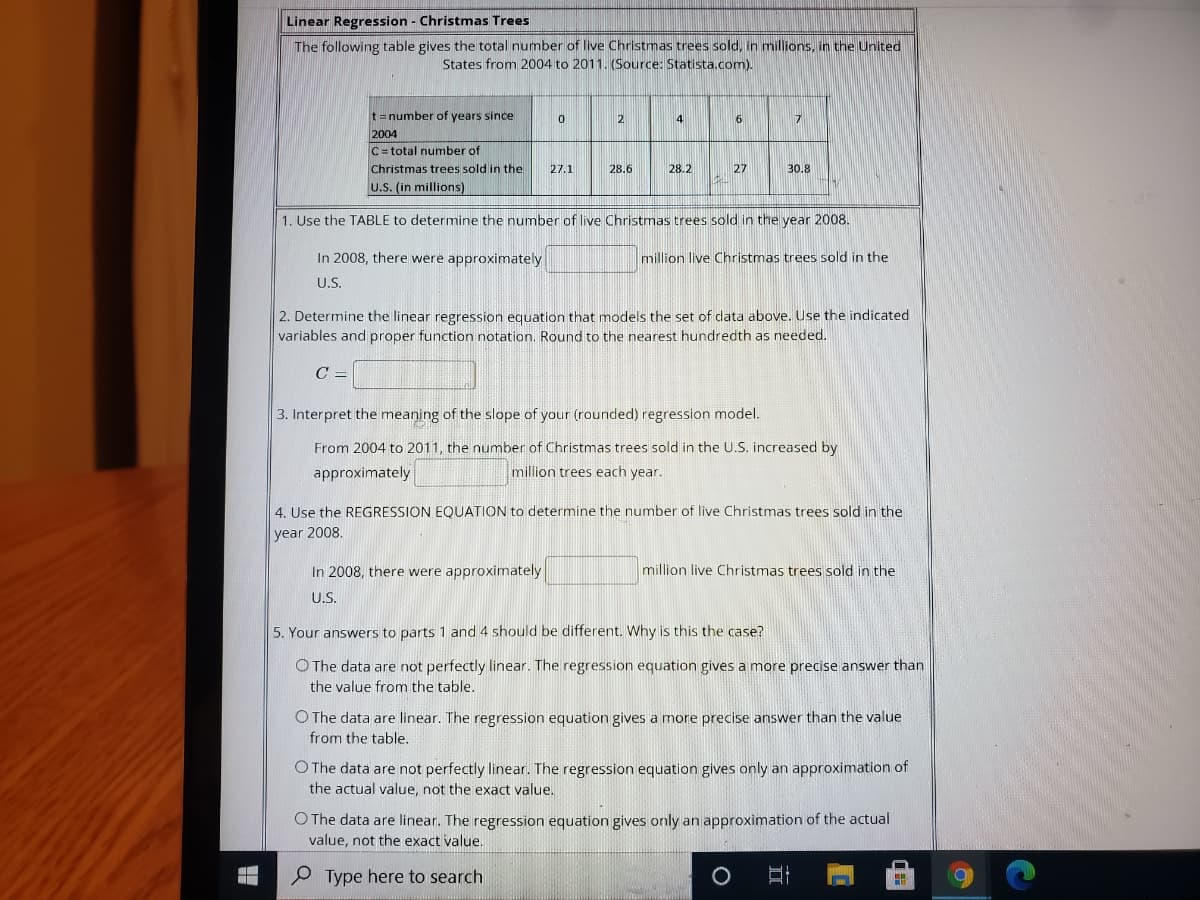
Transcribed Image Text:Linear Regression - Christmas Trees
The following table gives the total number of live Christmas trees sold, in millions, in the United
States from 2004 to 2011. (Source: Statista.com).
t=number of years since
2004
C= total number of
2
4
6
17
Christmas trees sold in the
27.1
28.6
28.2
27
30.8
U.S. (in millions)
1. Use the TABLE to determine the number of live Christmas trees sold in the year 2008.
In 2008, there were approximately
million live Christmas trees sold in the
U.S.
2. Determine the linear regression equation that models the set of data above. Use the indicated
variables and proper function notation. Round to the nearest hundredth as needed.
C =
3. Interpret the meaning of the slope of your (rounded) regression model.
From 2004 to 2011, the number of Christmas trees sold in the U.S. increased by
approximately
million trees each year.
4. Use the REGRESSION EQUATION to determine the number of live Christmas trees sold in the
year 2008.
In 2008, there were approximately
million live Christmas trees sold in the
US.
5. Your answers to parts 1 and 4 should be different. Why is this the case?
O The data are not perfectly linear. The regression equation gives a more precise answer than
the value from the table.
O The data are linear. The regression equation gives a more precise answer than the value
from the table.
O The data are not perfectly linear. The regression equation gives only an approximation of
the actual value, not the exact value.
O The data are linear. The regression equation gives only an approximation of the actual
value, not the exact value.
Type here to search
Expert Solution
This question has been solved!
Explore an expertly crafted, step-by-step solution for a thorough understanding of key concepts.

This is a popular solution!

Trending now
This is a popular solution!

Step by step
Solved in 5 steps

Recommended textbooks for you
Functions and Change: A Modeling Approach to Coll…
Algebra
ISBN:
9781337111348
Author:
Bruce Crauder, Benny Evans, Alan Noell
Publisher:
Cengage Learning

Algebra and Trigonometry (MindTap Course List)
Algebra
ISBN:
9781305071742
Author:
James Stewart, Lothar Redlin, Saleem Watson
Publisher:
Cengage Learning

College Algebra (MindTap Course List)
Algebra
ISBN:
9781305652231
Author:
R. David Gustafson, Jeff Hughes
Publisher:
Cengage Learning
Functions and Change: A Modeling Approach to Coll…
Algebra
ISBN:
9781337111348
Author:
Bruce Crauder, Benny Evans, Alan Noell
Publisher:
Cengage Learning
Algebra and Trigonometry (MindTap Course List)
Algebra
ISBN:
9781305071742
Author:
James Stewart, Lothar Redlin, Saleem Watson
Publisher:
Cengage Learning
College Algebra (MindTap Course List)
Algebra
ISBN:
9781305652231
Author:
R. David Gustafson, Jeff Hughes
Publisher:
Cengage Learning


College Algebra
Algebra
ISBN:
9781305115545
Author:
James Stewart, Lothar Redlin, Saleem Watson
Publisher:
Cengage Learning
