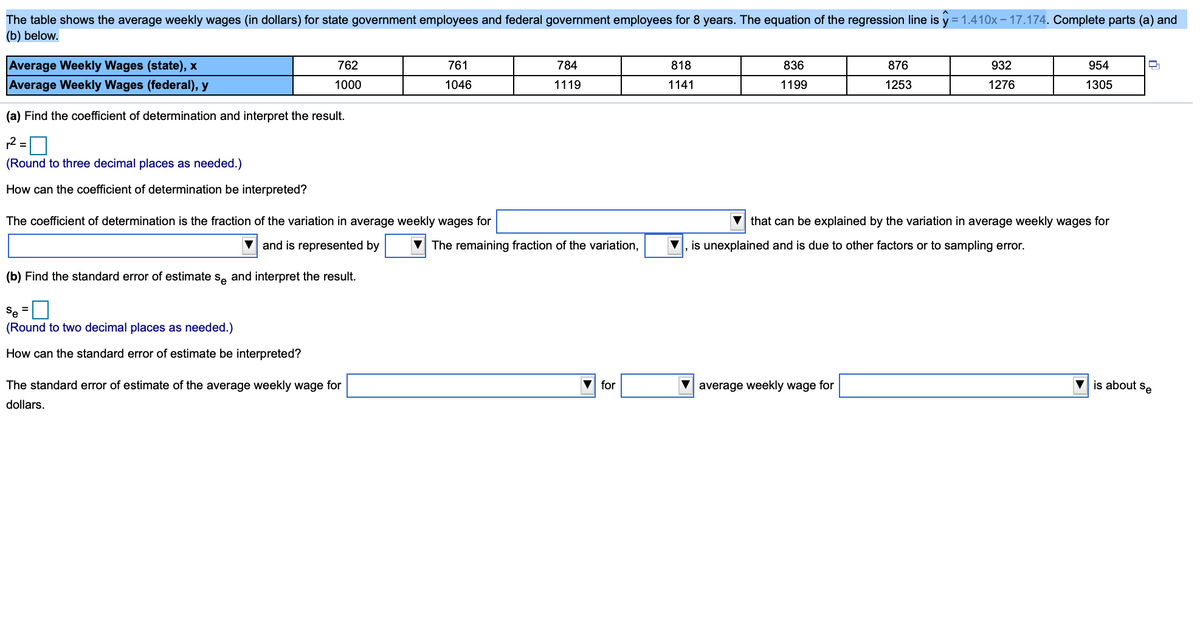
The table shows the average weekly wages (in dollars) for state government employees and federal government employees for 8 years. The equation of the regression line is y = 1.410x - 17.174. Complete parts (a) and (b) below. Average Weekly Wages (state), x Average Weekly Wages (federal), y 762 761 784 818 836 876 932 954 1000 1046 1119 1141 1199 1253 1276 1305 (a) Find the coefficient of determination and interpret the result. 12 =O (Round to three decimal places as needed.) How can the coefficient of determination be interpreted? The coefficient of determination is the fraction of the variation in average weekly wages for V that can be explained by the variation in average weekly wages for and is represented by V The remaining fraction of the variation, V, is unexplained and is due to other factors or to sampling error. (b) Find the standard error of estimate se and interpret the result. (Round to two decimal places as needed.) How can the standard error of estimate be interpreted? The standard error of estimate of the average weekly wage for V for average weekly wage for V is about se dollars.


Correlation
Correlation defines a relationship between two independent variables. It tells the degree to which variables move in relation to each other. When two sets of data are related to each other, there is a correlation between them.
Linear Correlation
A correlation is used to determine the relationships between numerical and categorical variables. In other words, it is an indicator of how things are connected to one another. The correlation analysis is the study of how variables are related.
Regression Analysis
Regression analysis is a statistical method in which it estimates the relationship between a dependent variable and one or more independent variable. In simple terms dependent variable is called as outcome variable and independent variable is called as predictors. Regression analysis is one of the methods to find the trends in data. The independent variable used in Regression analysis is named Predictor variable. It offers data of an associated dependent variable regarding a particular outcome.
The table shows the average weekly wages (in dollars) for state government employees and federal government employees for 8 years. The equation of the regression line is y=1.410x−17.174.
Complete parts (a) and(b) below.


Trending now
This is a popular solution!

Step by step
Solved in 2 steps with 2 images


