50 Residual A least squares regression analysis of the typical pulse rate (in beats per minute) versus typical weight (in kg) for ten mammal species produced the following residual plot. Residual Plot for Pulse Rate vs. Weight 150 00T 50- -50- 009 Welght 0. 1200 to 00 4. Which of the following statements are supported by this residual plot? I. The relationship between Pulse rate and Weight is non-linear. II. The regression model on which this residual plot is based would be likely to underestimate the pulse rate of a mammal species that typically weighted 400 kg. III Larger species have faster pulse rates than smaller species. I only a. b. II only III only c. d. I and II are true c. None of these statements is true 5. The scatterplot of Log (Pulse rate) versus Log (Weight) shows a strong, positive, linear pattern. Which of the following conclusions can be drawn from this information? The relationship between Pulse rate and Weight can be modeled well by an a. exponential function b. The relationship between Pulse rate and Weight be modeled well by a power function. The relationship between Pulse rate and Weight can be modeled well by a logarithmic function c. d. The residual plot for the regression of Log (Pulse rate) versus Log (Weight) will show a curved pattern similar to the one shown above e, The scatter plot of Log (Pulse rate) versus Weight will also show a strong, positive, linear pattern
50 Residual A least squares regression analysis of the typical pulse rate (in beats per minute) versus typical weight (in kg) for ten mammal species produced the following residual plot. Residual Plot for Pulse Rate vs. Weight 150 00T 50- -50- 009 Welght 0. 1200 to 00 4. Which of the following statements are supported by this residual plot? I. The relationship between Pulse rate and Weight is non-linear. II. The regression model on which this residual plot is based would be likely to underestimate the pulse rate of a mammal species that typically weighted 400 kg. III Larger species have faster pulse rates than smaller species. I only a. b. II only III only c. d. I and II are true c. None of these statements is true 5. The scatterplot of Log (Pulse rate) versus Log (Weight) shows a strong, positive, linear pattern. Which of the following conclusions can be drawn from this information? The relationship between Pulse rate and Weight can be modeled well by an a. exponential function b. The relationship between Pulse rate and Weight be modeled well by a power function. The relationship between Pulse rate and Weight can be modeled well by a logarithmic function c. d. The residual plot for the regression of Log (Pulse rate) versus Log (Weight) will show a curved pattern similar to the one shown above e, The scatter plot of Log (Pulse rate) versus Weight will also show a strong, positive, linear pattern

Algebra and Trigonometry (MindTap Course List)
4th Edition
ISBN:9781305071742
Author:James Stewart, Lothar Redlin, Saleem Watson
Publisher:James Stewart, Lothar Redlin, Saleem Watson
Chapter1: Equations And Graphs
Section1.FOM: Focus On Modeling: Fitting Lines To Data
Problem 7P

Related questions
Question
Look at the attached photo plz
Transcribed Image Text:50
Residual
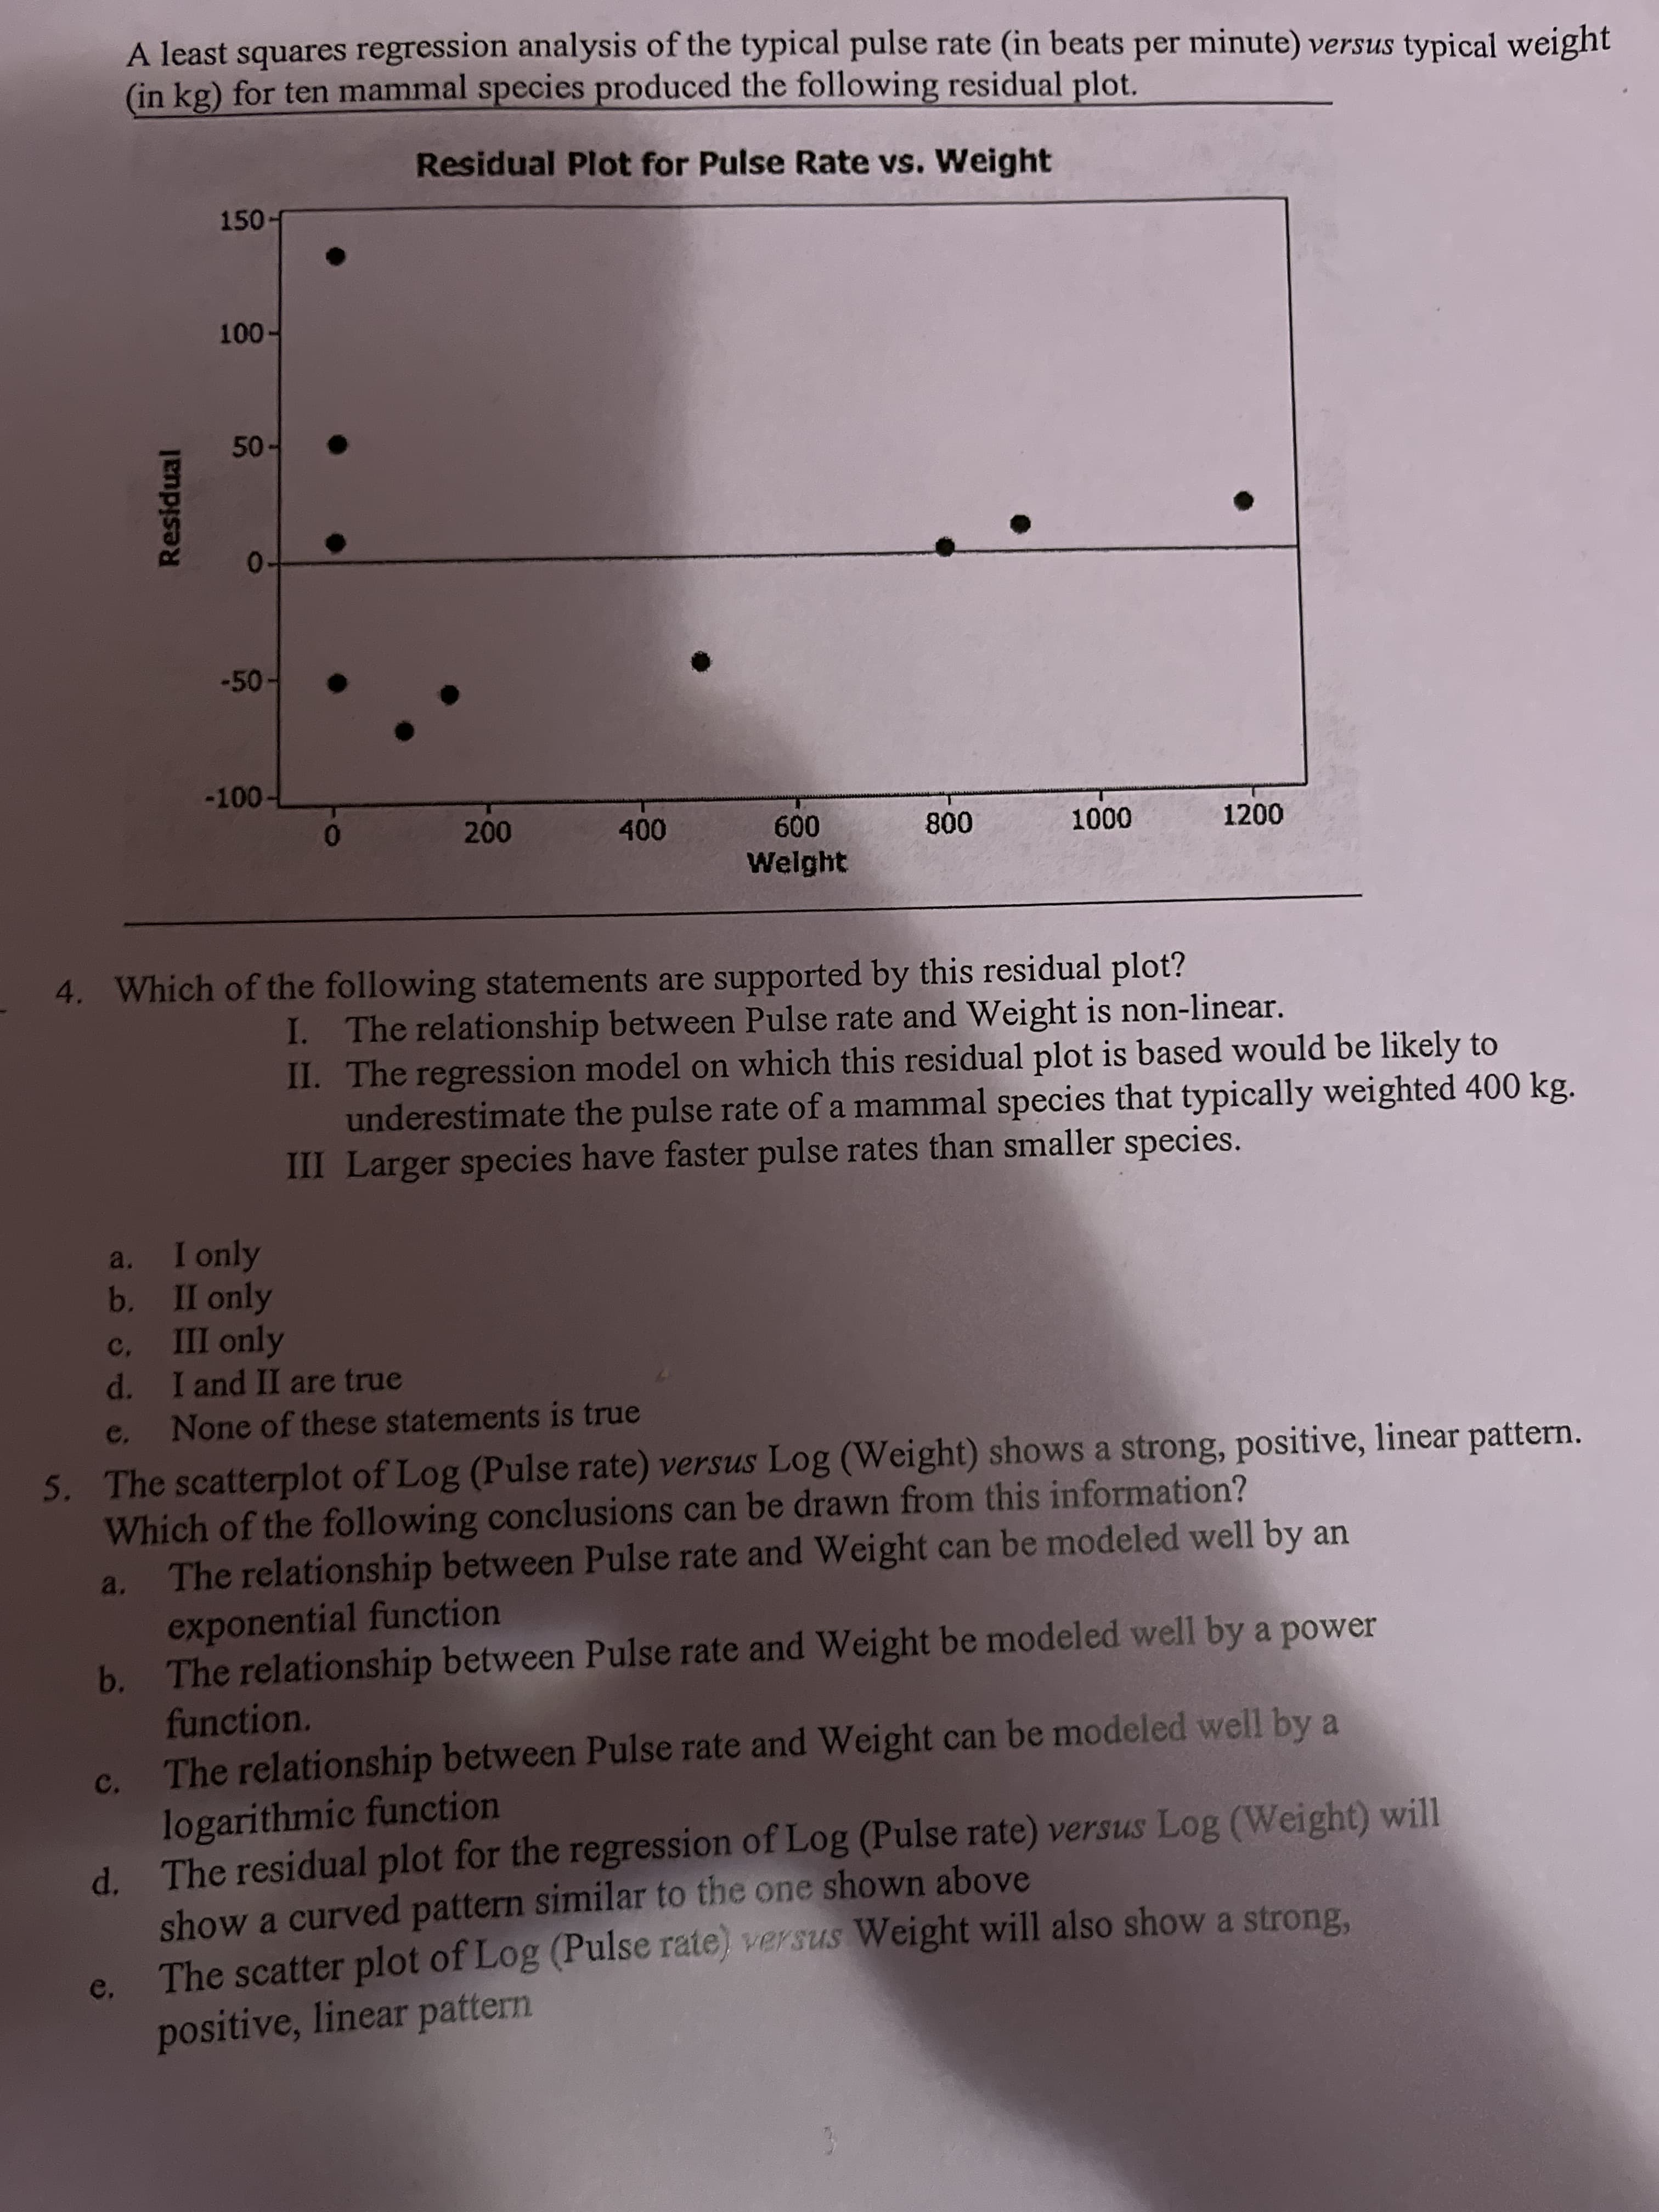
A least squares regression analysis of the typical pulse rate (in beats per minute) versus typical weight
(in kg) for ten mammal species produced the following residual plot.
Residual Plot for Pulse Rate vs. Weight
150
00T
50-
-50-
009
Welght
0.
1200
to 00
4. Which of the following statements are supported by this residual plot?
I. The relationship between Pulse rate and Weight is non-linear.
II. The regression model on which this residual plot is based would be likely to
underestimate the pulse rate of a mammal species that typically weighted 400 kg.
III Larger species have faster pulse rates than smaller species.
I only
a.
b. II only
III only
c.
d. I and II are true
c.
None of these statements is true
5. The scatterplot of Log (Pulse rate) versus Log (Weight) shows a strong, positive, linear pattern.
Which of the following conclusions can be drawn from this information?
The relationship between Pulse rate and Weight can be modeled well by an
a.
exponential function
b. The relationship between Pulse rate and Weight be modeled well by a power
function.
The relationship between Pulse rate and Weight can be modeled well by a
logarithmic function
c.
d. The residual plot for the regression of Log (Pulse rate) versus Log (Weight) will
show a curved pattern similar to the one shown above
e,
The scatter plot of Log (Pulse rate) versus Weight will also show a strong,
positive, linear pattern
Expert Solution
This question has been solved!
Explore an expertly crafted, step-by-step solution for a thorough understanding of key concepts.

This is a popular solution!

Trending now
This is a popular solution!

Step by step
Solved in 2 steps

Recommended textbooks for you
Algebra and Trigonometry (MindTap Course List)
Algebra
ISBN:
9781305071742
Author:
James Stewart, Lothar Redlin, Saleem Watson
Publisher:
Cengage Learning

Functions and Change: A Modeling Approach to Coll…
Algebra
ISBN:
9781337111348
Author:
Bruce Crauder, Benny Evans, Alan Noell
Publisher:
Cengage Learning

College Algebra
Algebra
ISBN:
9781305115545
Author:
James Stewart, Lothar Redlin, Saleem Watson
Publisher:
Cengage Learning
Algebra and Trigonometry (MindTap Course List)
Algebra
ISBN:
9781305071742
Author:
James Stewart, Lothar Redlin, Saleem Watson
Publisher:
Cengage Learning
Functions and Change: A Modeling Approach to Coll…
Algebra
ISBN:
9781337111348
Author:
Bruce Crauder, Benny Evans, Alan Noell
Publisher:
Cengage Learning
College Algebra
Algebra
ISBN:
9781305115545
Author:
James Stewart, Lothar Redlin, Saleem Watson
Publisher:
Cengage Learning

Elementary Linear Algebra (MindTap Course List)
Algebra
ISBN:
9781305658004
Author:
Ron Larson
Publisher:
Cengage Learning

Glencoe Algebra 1, Student Edition, 9780079039897…
Algebra
ISBN:
9780079039897
Author:
Carter
Publisher:
McGraw Hill
