*See the attached photo for examples* A. Given a normal distribution with a mean of 42 and standard deviation of 6, find the area BELOW: 1. 36 2. 54 3. 38 B. Given a normal distribution with a mean of 125 and standard deviation of 15, find the area ABOVE: 1. 128 2. 119 3. 158 C. Given a normal distribution with a mean of 24 and standard deviation of 4, find the area between the following: 1. 28 and 30 2. 17 and 24 3. 18 and 26
*See the attached photo for examples* A. Given a normal distribution with a mean of 42 and standard deviation of 6, find the area BELOW: 1. 36 2. 54 3. 38 B. Given a normal distribution with a mean of 125 and standard deviation of 15, find the area ABOVE: 1. 128 2. 119 3. 158 C. Given a normal distribution with a mean of 24 and standard deviation of 4, find the area between the following: 1. 28 and 30 2. 17 and 24 3. 18 and 26

Glencoe Algebra 1, Student Edition, 9780079039897, 0079039898, 2018
18th Edition
ISBN:9780079039897
Author:Carter
Publisher:Carter
Chapter10: Statistics
Section10.5: Comparing Sets Of Data
Problem 29PFA

Related questions

Question
*See the attached photo for examples*
A. Given a normal distribution with a mean of 42 and standard deviation of 6, find the area BELOW:
1. 36
2. 54
3. 38
B. Given a normal distribution with a mean of 125 and standard deviation of 15, find the area ABOVE:
1. 128
2. 119
3. 158
C. Given a normal distribution with a mean of 24 and standard deviation of 4, find the area between the following:
1. 28 and 30
2. 17 and 24
3. 18 and 26
Transcribed Image Text:Lesson
Applications of Normal Distribution
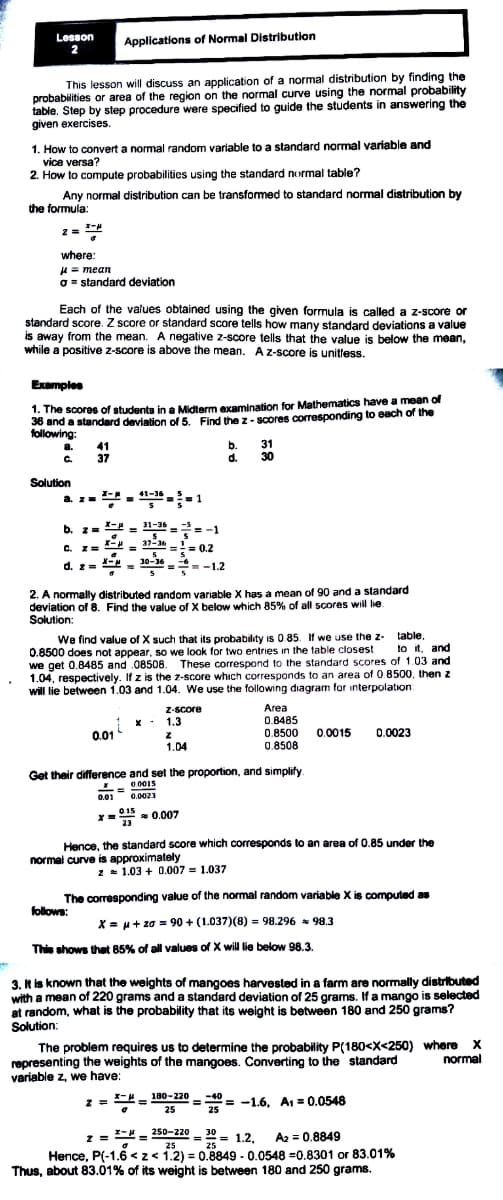
This lesson will discuss an application of a normal distribution by finding the
probabilities or area of the region on the normal curve using the normal probability
table. Step by step procedure were specified to guide the students in answering the
given exercises.
1. How to convert a normal random variable to a standard normal variable and
vice versa?
2. How to compute probabilities using the standard normal table?
Any normal distribution can be transformed to standard normal distribution by
the formula:
where:
H = mean
O = standard deviation
Each of the values obtained using the given formula is called a z-score or
standard score. Z score or standard score tells how many standard deviations a value
is away from the mean. A negative z-score tells that the value is below the mean,
while a positive z-score is above the mean. Az-score is unitless.
Examples
1. The scores of students in a Midterm examination for Mathematics have a mean of
36 and a standard deviation of 5. Find the z - scores corresponding to each of the
following:
a. 41
b.
d.
31
30
C 37
Solution
41-36
a. z=
b. z=
X- - 31-36 -2- -1
= -1
C. z =
37-36
-- == 0.2
d. z= 2 = 10-36
=-1.2
2. A normally distributed random variable X has a mean of 90 and a standard
deviation of 8. Find the value of X below which 85% of all scores will lie.
Solution:
We find value of X such that its probability is 0 85. If we use the z-
0.8500 does not appear, so we look for two entries in the table closest
we get 0.8485 and 08508. These correspond to the standard scores of 1.03 and
1.04, respectively. If z is the z-score whıch corresponds to an area of 0 8500, then z
will lie between 1.03 and 1.04. We use the following diagram for interpolation
table
to it, and
fzi
Area
0.8485
0.8500 0.0015
0.8508
Z-score
1.3
0.01
0.0023
1.04
Get their difference and set the proportion, and simplify
0 0015
0.0023
0.01
* = 0.007
015
- 0.007
Hence, the standard score which corresponds to an area of 0.85 under the
normal curve is approximately
2 1.03 + 0.007 = 1.037
The corresponding value of the normal random variable X is computed as
follows:
X = u+ za = 90 + (1.037)(8) = 98.296 = 98.3
Thie shows that 85% of all values of X will lie below 98.3
3. k is known that the weights of mangoes harvested in a farm are normally distributed
with a mean of 220 grams and a standard deviation of 25 grams. If a mango is selected
at random, what is the probability that its weight is between 180 and 250 grams?
Solution:
The problem requires us to determine the probability P(180<X<250) where X
representing the weights of the mangoes. Converting to the standard
variable z, we have:
normal
,- -= 180 – 220 = -40 =
25
= -1.6, A1 = 0.0548
25
z = = 250-220 - 30 = 1.2.
A2 = 0.8849
25
Hence, P(-1.6 <z< 1.2) = 0.8849 - 0.0548 =0.8301 or 83.01%
Thus, about 83.01% of its weight is between 180 and 250 grams.
25
Expert Solution
This question has been solved!
Explore an expertly crafted, step-by-step solution for a thorough understanding of key concepts.

This is a popular solution!

Trending now
This is a popular solution!

Step by step
Solved in 4 steps

Knowledge Booster


Learn more about
Need a deep-dive on the concept behind this application? Look no further. Learn more about this topic, statistics and related others by exploring similar questions and additional content below.Recommended textbooks for you
Glencoe Algebra 1, Student Edition, 9780079039897…
Algebra
ISBN:
9780079039897
Author:
Carter
Publisher:
McGraw Hill
Glencoe Algebra 1, Student Edition, 9780079039897…
Algebra
ISBN:
9780079039897
Author:
Carter
Publisher:
McGraw Hill