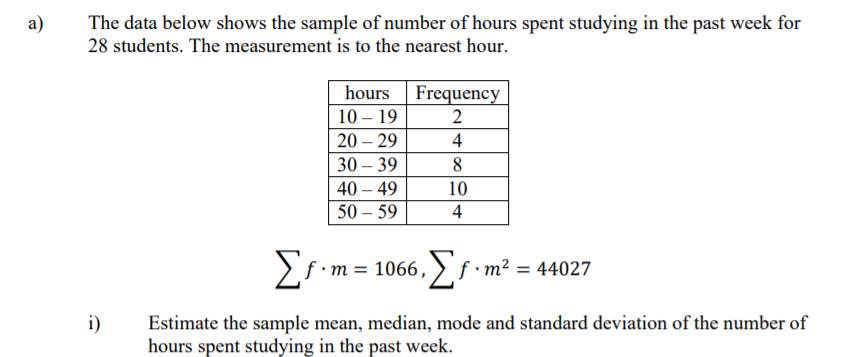
The data below shows the sample of number of hours spent studying in the past week for 28 students. The measurement is to the nearest hour. a) hours Frequency 10 – 19 20 – 29 4 30 – 39 8 40 – 49 10 50 – 59 4 E1-m = 1066, f-m² = 44027 i) Estimate the sample mean, median, mode and standard deviation of the number of hours spent studying in the past week.
The data below shows the sample of number of hours spent studying in the past week for 28 students. The measurement is to the nearest hour. a) hours Frequency 10 – 19 20 – 29 4 30 – 39 8 40 – 49 10 50 – 59 4 E1-m = 1066, f-m² = 44027 i) Estimate the sample mean, median, mode and standard deviation of the number of hours spent studying in the past week.

Glencoe Algebra 1, Student Edition, 9780079039897, 0079039898, 2018
18th Edition
ISBN:9780079039897
Author:Carter
Publisher:Carter
Chapter10: Statistics
Section10.5: Comparing Sets Of Data
Problem 13PPS

Related questions
Question
Transcribed Image Text:The data below shows the sample of number of hours spent studying in the past week for
28 students. The measurement is to the nearest hour.
a)
hours Frequency
10 – 19
20 – 29
4
30 – 39
8
40 – 49
10
50 – 59
4
Er-m = 1066. f -m²
= 44027
i)
Estimate the sample mean, median, mode and standard deviation of the number of
hours spent studying in the past week.
Expert Solution
This question has been solved!
Explore an expertly crafted, step-by-step solution for a thorough understanding of key concepts.

Step by step
Solved in 3 steps with 3 images

Recommended textbooks for you
Glencoe Algebra 1, Student Edition, 9780079039897…
Algebra
ISBN:
9780079039897
Author:
Carter
Publisher:
McGraw Hill
Glencoe Algebra 1, Student Edition, 9780079039897…
Algebra
ISBN:
9780079039897
Author:
Carter
Publisher:
McGraw Hill