Separate random samples were collected by a polling agency to investigate the difference in employee satisfaction at non-profit organizations and at for-profit companies. Data collected from 433 employees at non-profit organizations revealed that 391 of them were "highly satisfied." From the for-profit companies, 426 out of 507 employees reported the s level of satisfaction. Researchers want to test if the proportions of satisfied employees are the same at for-profit compani- as at non-profit companies. Complete parts a through c below. P1 a) What is the difference in the proportions of the two types of companies? Assume p₁ is the proportion of satisfied non-p employees and p2 is the proportion of satisfied for-profit employees. The difference in the sample proportions, P₁-P2, is (Round to three decimal places as needed.)
Separate random samples were collected by a polling agency to investigate the difference in employee satisfaction at non-profit organizations and at for-profit companies. Data collected from 433 employees at non-profit organizations revealed that 391 of them were "highly satisfied." From the for-profit companies, 426 out of 507 employees reported the s level of satisfaction. Researchers want to test if the proportions of satisfied employees are the same at for-profit compani- as at non-profit companies. Complete parts a through c below. P1 a) What is the difference in the proportions of the two types of companies? Assume p₁ is the proportion of satisfied non-p employees and p2 is the proportion of satisfied for-profit employees. The difference in the sample proportions, P₁-P2, is (Round to three decimal places as needed.)

Holt Mcdougal Larson Pre-algebra: Student Edition 2012
1st Edition
ISBN:9780547587776
Author:HOLT MCDOUGAL
Publisher:HOLT MCDOUGAL
Chapter11: Data Analysis And Probability
Section11.4: Collecting Data
Problem 5E

Related questions
Question
100%
Also find :
Test Statistics, z
Find the P value at alpha =0.05
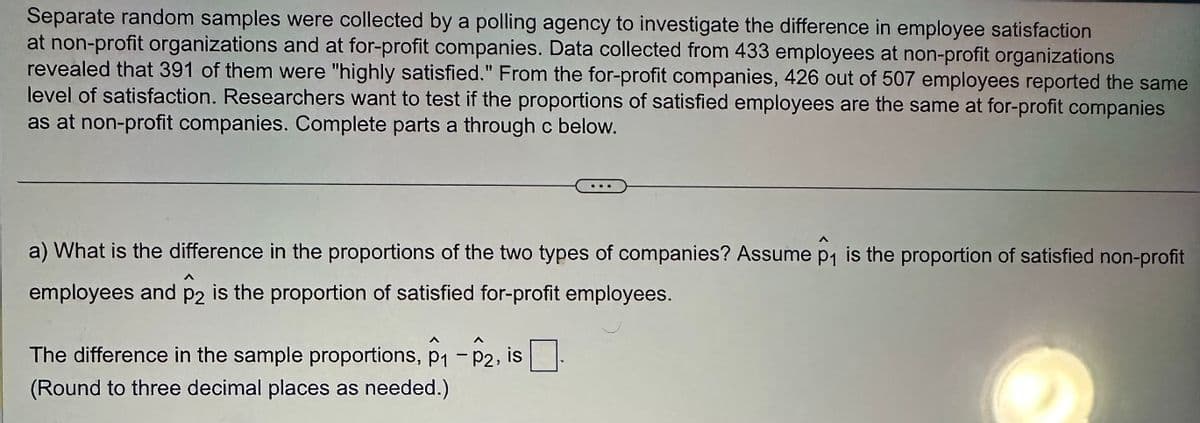
Transcribed Image Text:Separate random samples were collected by a polling agency to investigate the difference in employee satisfaction
at non-profit organizations and at for-profit companies. Data collected from 433 employees at non-profit organizations
revealed that 391 of them were "highly satisfied." From the for-profit companies, 426 out of 507 employees reported the same
level of satisfaction. Researchers want to test if the proportions of satisfied employees are the same at for-profit companies
as at non-profit companies. Complete parts a through c below.
a) What is the difference in the proportions of the two types of companies? Assume p₁ is the proportion of satisfied non-profit
employees and p2 is the proportion of satisfied for-profit employees.
P2
The difference in the sample proportions, p₁ - P2, is
(Round to three decimal places as needed.)
Expert Solution
This question has been solved!
Explore an expertly crafted, step-by-step solution for a thorough understanding of key concepts.

This is a popular solution!

Trending now
This is a popular solution!

Step by step
Solved in 4 steps with 10 images

Recommended textbooks for you
Holt Mcdougal Larson Pre-algebra: Student Edition…
Algebra
ISBN:
9780547587776
Author:
HOLT MCDOUGAL
Publisher:
HOLT MCDOUGAL

Glencoe Algebra 1, Student Edition, 9780079039897…
Algebra
ISBN:
9780079039897
Author:
Carter
Publisher:
McGraw Hill

College Algebra (MindTap Course List)
Algebra
ISBN:
9781305652231
Author:
R. David Gustafson, Jeff Hughes
Publisher:
Cengage Learning
Holt Mcdougal Larson Pre-algebra: Student Edition…
Algebra
ISBN:
9780547587776
Author:
HOLT MCDOUGAL
Publisher:
HOLT MCDOUGAL
Glencoe Algebra 1, Student Edition, 9780079039897…
Algebra
ISBN:
9780079039897
Author:
Carter
Publisher:
McGraw Hill
College Algebra (MindTap Course List)
Algebra
ISBN:
9781305652231
Author:
R. David Gustafson, Jeff Hughes
Publisher:
Cengage Learning