SESSION 1.2: SELF-ASSESSMENT EXERCISE 1. Briefly explain the use of graphs as a way to represent economic relationships. What is an inverse relationship? How does it graph? What is direct relationship? How does it graph? 2. Graph each of the following sets of numbers in table 2 below. Draw a line through the points and calculate the slope of each line. X 1 C 1 Y 5 10 X 0 5 2 Y 0 5 X 1 2 3 Y 25 20 X 0.1 0.2 4 Y 100 75
SESSION 1.2: SELF-ASSESSMENT EXERCISE 1. Briefly explain the use of graphs as a way to represent economic relationships. What is an inverse relationship? How does it graph? What is direct relationship? How does it graph? 2. Graph each of the following sets of numbers in table 2 below. Draw a line through the points and calculate the slope of each line. X 1 C 1 Y 5 10 X 0 5 2 Y 0 5 X 1 2 3 Y 25 20 X 0.1 0.2 4 Y 100 75

Macroeconomics: Principles and Policy (MindTap Course List)
13th Edition
ISBN:9781305280601
Author:William J. Baumol, Alan S. Blinder
Publisher:William J. Baumol, Alan S. Blinder
Chapter1: What Is Economics
Section1.A: Using Graphs: A Review
Problem 3TY

Related questions
Question
Transcribed Image Text:CH
SESSION 1.2: SELF-ASSESSMENT EXERCISE
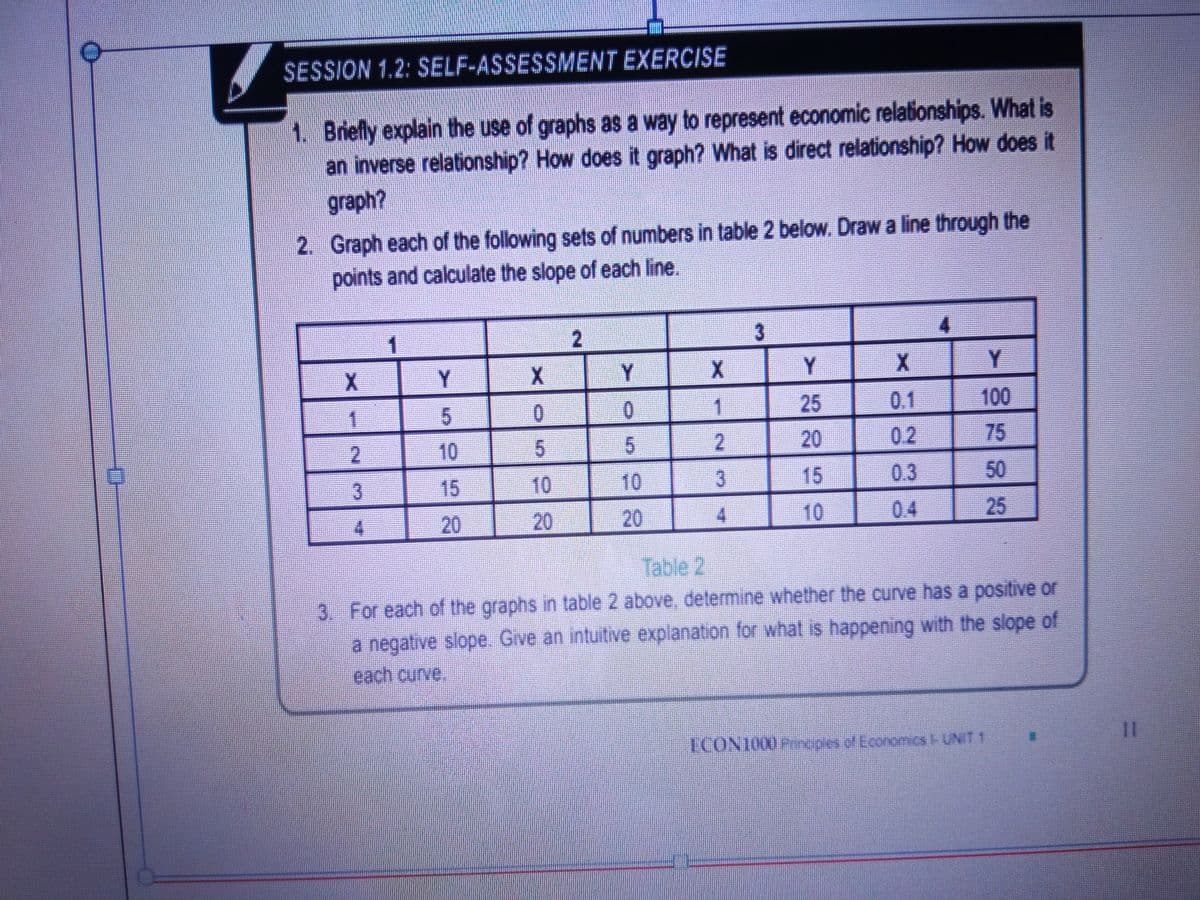
1. Briefly explain the use of graphs as a way to represent economic relationships. What is
an inverse relationship? How does it graph? What is direct relationship? How does it
graph?
2. Graph each of the following sets of numbers in table 2 below. Draw a line through the
points and calculate the slope of each line.
2X4
1
2
3
1
Y
5
10
20
X
0
5
20
2
Y
0
5
10
20
X
1
2
3
3
Y
25
20
15
X
0.1
0.3
Y
100
75
50
25
Table 2
3. For each of the graphs in table 2 above, determine whether the curve has a positive or
a negative slope. Give an intuitive explanation for what is happening with the slope of
each curve.
ICON 1000 Principles of Economics I- UNIT 1
11
Expert Solution
This question has been solved!
Explore an expertly crafted, step-by-step solution for a thorough understanding of key concepts.

Step by step
Solved in 3 steps with 6 images

Knowledge Booster


Learn more about
Need a deep-dive on the concept behind this application? Look no further. Learn more about this topic, economics and related others by exploring similar questions and additional content below.Recommended textbooks for you
Macroeconomics: Principles and Policy (MindTap Co…
Economics
ISBN:
9781305280601
Author:
William J. Baumol, Alan S. Blinder
Publisher:
Cengage Learning


Macroeconomics: Principles and Policy (MindTap Co…
Economics
ISBN:
9781305280601
Author:
William J. Baumol, Alan S. Blinder
Publisher:
Cengage Learning

Economics (MindTap Course List)
Economics
ISBN:
9781337617383
Author:
Roger A. Arnold
Publisher:
Cengage Learning

