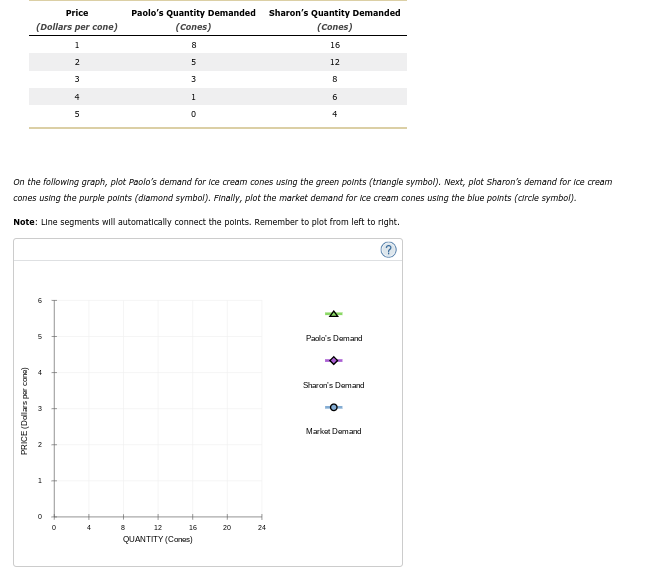
Suppose that Paolo and Sharon are the only consumers of ice cream cones in a particular market. The following table shows their monthly demand schedules: Price Paolo’s Quantity Demanded Sharon’s Quantity Demanded (Dollars per cone) (Cones) (Cones) 1 8 16 2 5 12 3 3 8 4 1 6 5 0 4
Suppose that Paolo and Sharon are the only consumers of ice cream cones in a particular market. The following table shows their monthly demand schedules: Price Paolo’s Quantity Demanded Sharon’s Quantity Demanded (Dollars per cone) (Cones) (Cones) 1 8 16 2 5 12 3 3 8 4 1 6 5 0 4

Chapter5: Markets In Motion And Price Controls
Section: Chapter Questions
Problem 10P

Related questions
Question
Suppose that Paolo and Sharon are the only consumers of ice cream cones in a particular market. The following table shows their monthly demand schedules:
|
|
Paolo’s Quantity Demanded
|
Sharon’s Quantity Demanded
|
|---|---|---|
|
(Dollars per cone)
|
(Cones)
|
(Cones)
|
| 1 | 8 | 16 |
| 2 | 5 | 12 |
| 3 | 3 | 8 |
| 4 | 1 | 6 |
| 5 | 0 | 4 |
On the following graph, plot Paolo’s demand for ice cream cones using the green points (triangle symbol). Next, plot Sharon’s demand for ice cream cones using the purple points (diamond symbol). Finally, plot the market demand for ice cream cones using the blue points (circle symbol).
Note: Line segments will automatically connect the points. Remember to plot from left to right.
Transcribed Image Text:Price
(Dollars per cone)
1
2
3
PRICE (Dollars par cane)
On the following graph, plot Paolo's demand for ice cream cones using the green points (triangle symbol). Next, plot sharon's demand for ice cream
cones using the purple points (diamond symbol). Finally, plot the market demand for ice cream cones using the blue points (circle symbol).
Note: Line segments will automatically connect the points. Remember to plot from left to right.
5
N
1
0
5
0
4
Paolo's Quantity Demanded Sharon's Quantity Demanded
(Cones)
(Cones)
8
16
5
12
3
8
1
6
0
4
8
12
16
QUANTITY (Cones)
20
24
4
Paolo's Demand
Sharon's Demand
Market Demand
Expert Solution
This question has been solved!
Explore an expertly crafted, step-by-step solution for a thorough understanding of key concepts.

This is a popular solution!

Trending now
This is a popular solution!

Step by step
Solved in 2 steps with 1 images

Knowledge Booster


Learn more about
Need a deep-dive on the concept behind this application? Look no further. Learn more about this topic, economics and related others by exploring similar questions and additional content below.Recommended textbooks for you
Exploring Economics
Economics
ISBN:
9781544336329
Author:
Robert L. Sexton
Publisher:
SAGE Publications, Inc


Exploring Economics
Economics
ISBN:
9781544336329
Author:
Robert L. Sexton
Publisher:
SAGE Publications, Inc


Microeconomics: Principles & Policy
Economics
ISBN:
9781337794992
Author:
William J. Baumol, Alan S. Blinder, John L. Solow
Publisher:
Cengage Learning