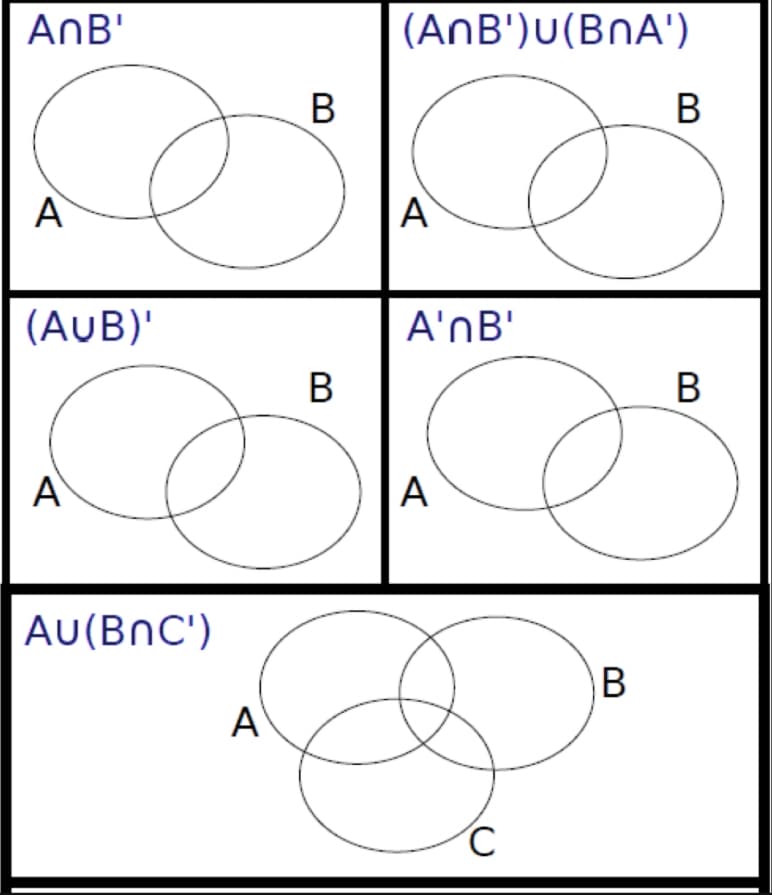
shade the area corresponding to the expression.


Q: Is the variance for the amount of money, in dollars, that shoppers spend on Saturdays at the mall…
A: Saturday Sunday 75 44 18 58 150 61 94 19 62 99 73 60 62 89 0 137 124 82 50 39…
Q: 4. A college wants to investigate whether students perform better on mornings that they have had a…
A: Sample size, n=100 Sample mean of difference, d¯=4.5 Sample sd of difference, sd=3.6 CL=0.95
Q: Find the margin of error for the 95% confidence interval used to estimate the population proportion.…
A: Confidence level = 95% Sample size (n) = 2440 Sample proportion (p̂) = 0.70
Q: You wish to test the following claim (Ha) at a significance level of a Ho : μ = 71.4 Ha : μ < 71.4 =…
A: here α = 0.002 null and alternate hypothesis H0 : μ = 71.4H1 : μ < 71.4 n =113 sample mean =…
Q: The following data represent salaries, in thousands of dollars, for employees of a small company.…
A: The question is about detection of outliers Given : To find : Does the last data value appea. to…
Q: You wish to test the following claim (Ha) at a significance level of a = 0.001. Ho : μ = 67.3 Ha : μ…
A: Answer:- Given, Hypotheses are, H0 : μ=67.3 Ha : μ≠67.3 (Two-tailed test) Population standard…
Q: Determine the z-test statistic, using the value for p from part a. Z= (Round to two decimal places…
A: Historically, about 53% of the population of a certain country believed that the planet's…
Q: The following data were collected from a Repeated-Measures study. Perform an ANOVA. Use…
A: We are given the following table: Person Trial 1 Trial 2 Trial 3 A 0 0 6 B 1 3 6 C…
Q: random sample of 473 students and professors were asked about their political party affiliation. The…
A: Total people=473
Q: Assume that the data has a normal distribution and the number of observation is greater than fifty.…
A: Significance level (alpha) = 0.09 We know that, If x is random variable from standard normal…
Q: 3 The Service Corps of Retired Executives collected the data below to see if their small business…
A: According to the information provided in the question, the service corps of retired executive…
Q: In an amusement arcade there is a horse race with horses coloured red, yellow and green. Only one…
A: In this amusement arcade scenario, players have the option to bet either 10p or 20p on a horse race…
Q: A group of people were asked if some psychics can help solve murder cases. 220 responded "yes", and…
A: Responded Yes = 220 Responded no = 482 Total = 702
Q: Use your knowledge of the expected values to find how many eggs, on average, you can expect from…
A: ANSWER: We have been given the following information: Number of White Leghorns: 10 Number of…
Q: An anthropology student proposes to model lifetimes of the human inhabitants of an island using the…
A: The failure rate function proposed by the student is given as: r(t)=K ; t≥0 and 0 ;…
Q: 6 7 You toss a 6-sided die 60 times and get the results shown in the table with a value of 11.8…
A: Null hypothesis: H0: That is, the die is fair. Alternative hypothesis: H1: That is, the die is not…
Q: Define the process X(t) = eaw (t)- za²t Use this process to answer the following problems. (a) Find…
A: In the given problem, we are introduced to a stochastic process represented by the equation:…
Q: A single, six-sided die is rolled. Find the probability of rolling an even number or a number less…
A: roll a six sidede diesample space : {1,2,3,4,5,6}total possible outcpmes = 6P(roll even number or…
Q: K Before every flight, the pilot must verify that the total weight of the load is less than the…
A: Sample size, n=41 Sample mean, x¯=183.6 Population sd, σ=35.4
Q: Calculate r for the set of data using any technology of your choice. Round values to the nearest…
A: The data is, x y 1 5 1.5 4.5 2 0.6 2.2 3.5 3.3 3 3.8 2.8 The sample size is n=6.
Q: quantitative. A sample data table is listed below Move time Piece Location (in seconds) pawn B3 65…
A: “Since you have asked multiple questions, we will solve the first question for you. If you want any…
Q: Find the E(X) of the random variable X with the following PDF: £x (x) = ²/2 [[0,1] (x) + ½ I (1,2)…
A: The pdf of a random variable X is given.
Q: The accompanying table shows results from a study in which some dental patients were treated with…
A: Answer Given level of significance =0.05 H0: The presence of any adverse health conditions is…
Q: Researchers want to know about the true proportion of adults with at least a high school education.…
A: The no. of sample size, i.e., the sampled no. of adults, n=1000. The no. of sampled adults, who have…
Q: Find 24th percentile, P24, from the following data 130 140 160 190 200 210 230 300 310 410 440 450…
A: Answer:- Given the following data 130, 140, 160, 190, 200, 210, 230, 300, 310, 410,…
Q: A record of a chess match records the chess piece used, the location of the piece and the length of…
A: The variables are: chess piece used, the location of the piece and the length of time used to make…
Q: Individuals of various age groups (18-35; 36-55; 56-75) were asked about their trust (measured on a…
A: As per the honor code and the guidelines we are supposed to answer the first question when multiple…
Q: Assume that a certain insurer has 1,000 policyholders of type 1 and 2,500 policyholders of type 2.…
A: In this problem, we are given information about an insurance company's policyholders. The insurer…
Q: Financial Sector Conforms yes no 1 10 15 2 3 10 15 30 20 Denote by A₁, A2, A3 the events the company…
A: The question is about probability Given : To find : a ) Prob. that a rand. selected belongs to…
Q: Using the following stem & leaf plot, find the five number summary for the data by hand. 1|01 2166…
A: Answer:- Given stem-and-leaf plot is Stem leaf 1 0 1 2 1 6 6 3 1 6 4 1 3 4 9 5 2 2 4 7…
Q: Assuming a normal curve a) what % of cases are between -1 and +1 standard deviations? b) what % of…
A: Assuming the normal curve we need to find the percentage of cases which comes under 1,2 and 3…
Q: The following are the ratings of men by women in an experiment involving speed dating. Use the given…
A: The question is about 5 no. summary and graphical representation of the data Given : To find : 1…
Q: + 7 + + 8 9 10 11 12 13 14 15 16 17 18 19 20 data Based on the boxplot above, identify the 5 number…
A: box plot for given data we have to identify five number summary and IQR.
Q: Find the (a) mean, (b) median, (c) mode, and (d) midrange for the data and then (e) answer the given…
A: The 11 observations (i.e., n=11) are: 14, 93, 82, 77, 32, 5, 62, 35, 2, 79, 6
Q: In each of the following situations, indicate whether Walters, CPA is using unrestricted random…
A: We need to determine if the given questions were chosen using UR, SR, H, or B.
Q: X 123456 у 4 11 28 59 140 300
A: The data is given as- X Y 1 4 2 11 3 28 4 59 5 140 6 300
Q: Your friend is thinking about buying shares of stock in a company. You have been tracking the…
A: It is required to identify the best graph to represent the data.
Q: Name the type of statistical test appropriate for each situation: a) You performed an ANOVA and…
A: a) For comparing pairs of group means after performing ANOVA, you would typically use post-hoc…
Q: Find the necessary confidence interval for the binomial proportion p. (Round your answers to three…
A: The 90% confidence interval for the true population proportion is obtained below as follows: The…
Q: n running a regression model with heteroscedastic errors, the estimators given by Weighted Least…
A: In running a regression model with heteroscedastic errors , the estimators given by weighed least…
Q: Which of the following will result from running a regression model with a high degree of correlation…
A: Multicollinearity exists when an independent variable is highly correlated with the other…
Q: In a biology class, there are 40 students, 18 of whom are female and 22 are male. If two students…
A:
Q: Q.23 Consider a drug that is used to help prevent blood clots in certain patients. In clinical…
A: Sample size, n=5991 No. of patients with adverse reaction of nausea, x=153 α=0.01
Q: Guide a hypothesis test by establishing Hypothesis, - Type of test, - Decision rule, and conclusion…
A: The data is given as- x¯1=450S1=120n1=10x¯2=420S2=150n2=12
Q: each of the following sampling scenarios, choose an appropriate test statistic for our hypothesis…
A: Answer Given Mean = 578 Standard deviation = 75
Q: Provide a set of 20 data points that has a mean of 20, a median of 25, an IQR of 10, and a sample…
A: To create a data set with the given characteristics, here's the plan I would follow: Start by…
Q: Assume that a sample is used to estimate a population mean . Find the 98% confidence interval for a…
A: Answer:- Given, Sample size, n = 54 Sample mean, X¯ = 84.5 Sample standard deviation, s = 21.6…
Q: what percent of values fall between 5.25 and 8.75 if the mean =8 and standard deviation =1.89
A: Mean=8 Standard deviations=1.89
Q: Data set One Results below represent caloric content of different foods 390 405 580 300 320 540 225…
A: x x2 390 152100 540 291600 535 286225 390 152100 320 102400 430 184900 405 164025…
Q: Fill in the blank. A is a table in which frequencies correspond to two variables. contingency table…
A: By using the given options: contingency table is correct.

Step by step
Solved in 3 steps with 1 images
