Shift the AD curve on the previous graph to show the effects of a decrease in the money supply. Note: Select and drag one or both of the curves to the desired position. Curves will snap into position, so if you try to move a curve and it snaps back to its original position, just drag it a little farther. Based on the new price level, the new money supply must be $ the ad curve is downward sloping, velocity is assumed to be constant, trillion in the long run if the velocity of money remains at 3. less than the same as , the percentage decrease in the price level is greater than Because the federal reserve controls M money supply. This illustrates the fact that monetary policy can increase real GDP, Importance of the federal reserve, simple quantity theory of money the percentage decrease in the
Shift the AD curve on the previous graph to show the effects of a decrease in the money supply. Note: Select and drag one or both of the curves to the desired position. Curves will snap into position, so if you try to move a curve and it snaps back to its original position, just drag it a little farther. Based on the new price level, the new money supply must be $ the ad curve is downward sloping, velocity is assumed to be constant, trillion in the long run if the velocity of money remains at 3. less than the same as , the percentage decrease in the price level is greater than Because the federal reserve controls M money supply. This illustrates the fact that monetary policy can increase real GDP, Importance of the federal reserve, simple quantity theory of money the percentage decrease in the

Brief Principles of Macroeconomics (MindTap Course List)
8th Edition
ISBN:9781337091985
Author:N. Gregory Mankiw
Publisher:N. Gregory Mankiw
Chapter16: The Influence Of Monetary And Fiscal Policy On Aggregate Demand
Section: Chapter Questions
Problem 5PA

Related questions
Question
pls also do the grph
Transcribed Image Text:upply
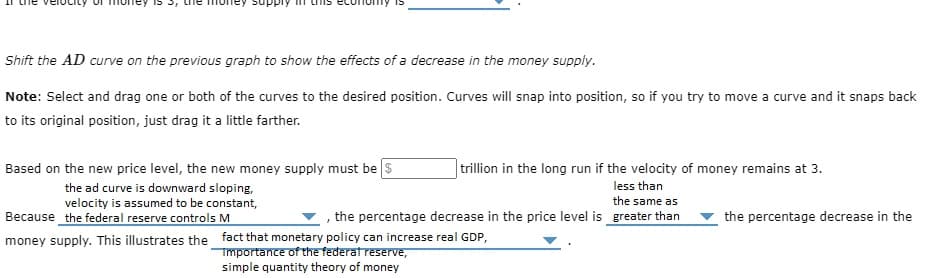
Shift the AD curve on the previous graph to show the effects of a decrease in the money supply.
Note: Select and drag one or both of the curves to the desired position. Curves will snap into position, so if you try to move a curve and it snaps back
to its original position, just drag it a little farther.
Based on the new price level, the new money supply must be $
the ad curve is downward sloping,
velocity is assumed to be constant,
Because the federal reserve controls M
trillion in the long run if the velocity of money remains at 3.
less than
the same as
, the percentage decrease in the price level is greater than
money supply. This illustrates the fact that monetary policy can increase real GDP,
Importance of the federal reserve,
simple quantity theory of money
the percentage decrease in the
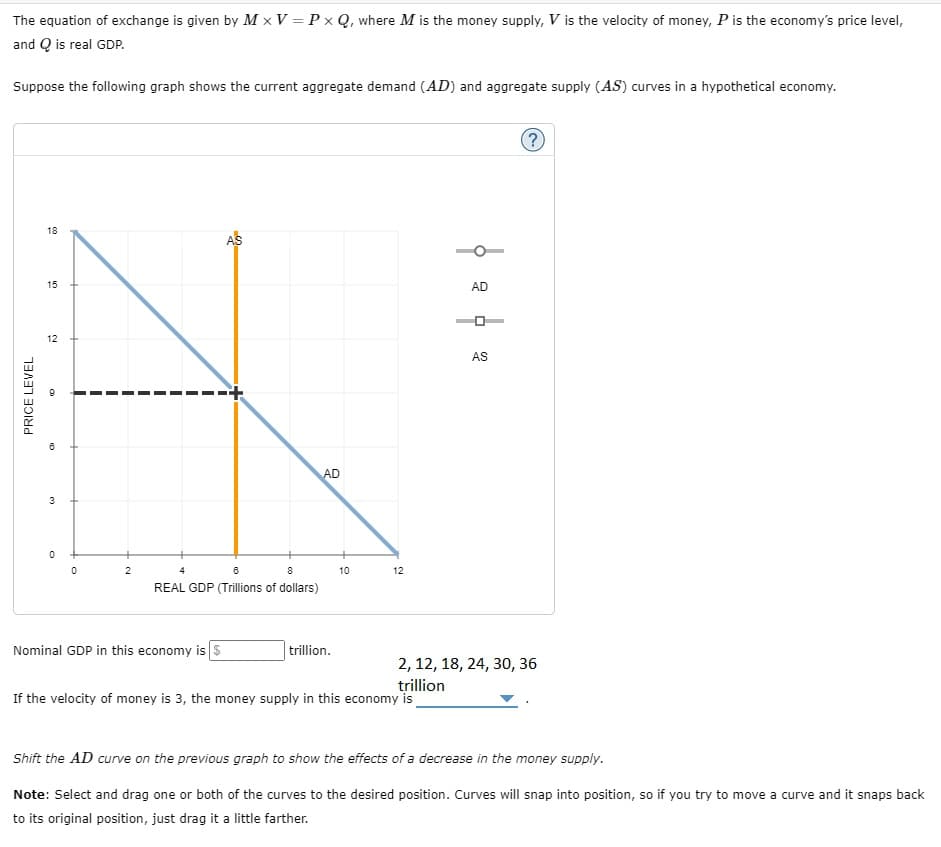
Transcribed Image Text:The equation of exchange is given by M x V = PxQ, where M is the money supply, V is the velocity of money, P is the economy's price level,
and Q is real GDP.
Suppose the following graph shows the current aggregate demand (AD) and aggregate supply (AS) curves in a hypothetical economy.
PRICE LEVEL
18
15
12
6
3
0
0
2
AS
4
6
8
REAL GDP (Trillions of dollars)
Nominal GDP in this economy is $
AD
trillion.
10
12
AD
If the velocity of money is 3, the money supply in this economy is
D
AS
?
2, 12, 18, 24, 30, 36
trillion
Shift the AD curve on the previous graph to show the effects of a decrease in the money supply.
Note: Select and drag one or both of the curves to the desired position. Curves will snap into position, so if you try to move a curve and it snaps back
to its original position, just drag it a little farther.
Expert Solution
This question has been solved!
Explore an expertly crafted, step-by-step solution for a thorough understanding of key concepts.

Step by step
Solved in 3 steps with 1 images

Knowledge Booster


Learn more about
Need a deep-dive on the concept behind this application? Look no further. Learn more about this topic, economics and related others by exploring similar questions and additional content below.Recommended textbooks for you
Brief Principles of Macroeconomics (MindTap Cours…
Economics
ISBN:
9781337091985
Author:
N. Gregory Mankiw
Publisher:
Cengage Learning

Essentials of Economics (MindTap Course List)
Economics
ISBN:
9781337091992
Author:
N. Gregory Mankiw
Publisher:
Cengage Learning

Exploring Economics
Economics
ISBN:
9781544336329
Author:
Robert L. Sexton
Publisher:
SAGE Publications, Inc
Brief Principles of Macroeconomics (MindTap Cours…
Economics
ISBN:
9781337091985
Author:
N. Gregory Mankiw
Publisher:
Cengage Learning
Essentials of Economics (MindTap Course List)
Economics
ISBN:
9781337091992
Author:
N. Gregory Mankiw
Publisher:
Cengage Learning
Exploring Economics
Economics
ISBN:
9781544336329
Author:
Robert L. Sexton
Publisher:
SAGE Publications, Inc
