short-run: select the graph that best demonstrates how both of the scenarios below will impact the market for fuel-efficient cars in the • There is increase in the cost of computer chips used in fuel-efficient cars to monitor gas mileage. • Consumers have expectations that the price of gasoline will increase in the future. Explain why you chose this graph to represent the impact in the market for fuel-efficient cars. What is the reason behind each shift/s? Paced on the dict will happen f and quantitu?
short-run: select the graph that best demonstrates how both of the scenarios below will impact the market for fuel-efficient cars in the • There is increase in the cost of computer chips used in fuel-efficient cars to monitor gas mileage. • Consumers have expectations that the price of gasoline will increase in the future. Explain why you chose this graph to represent the impact in the market for fuel-efficient cars. What is the reason behind each shift/s? Paced on the dict will happen f and quantitu?

Chapter1: Making Economics Decisions
Section: Chapter Questions
Problem 1QTC

Related questions
Question
Easy econ question, I will rate and like. Thank you!
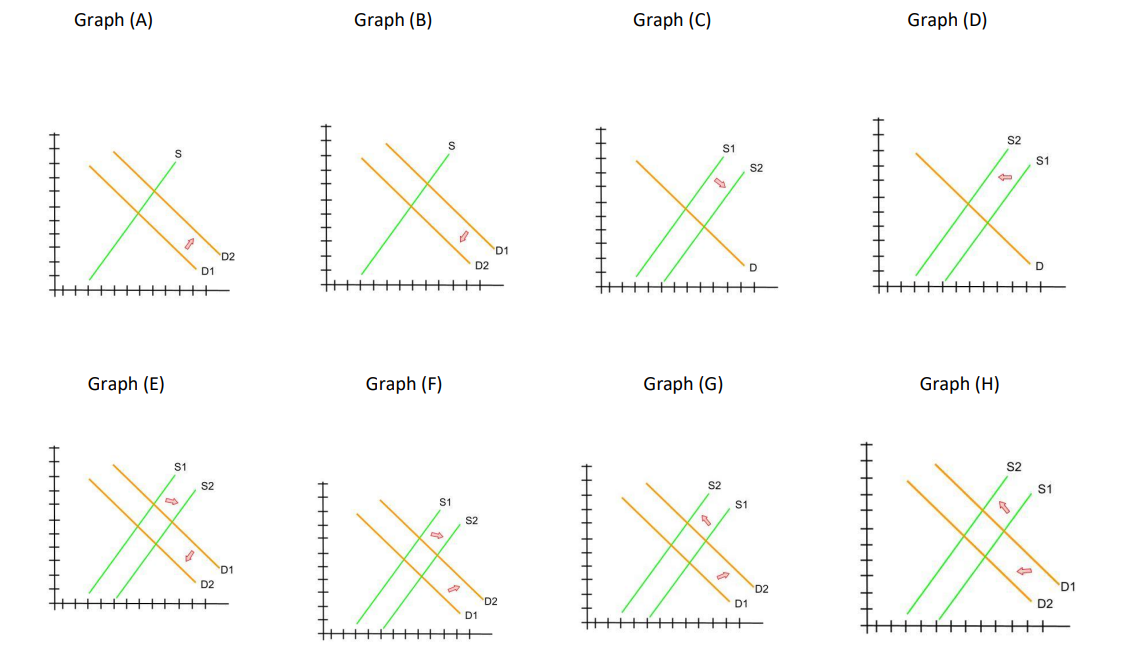
Transcribed Image Text:Graph (A)
Graph (B)
Graph (E)
S2
S
S1
S
S2
X X X X
D2
D2
D
D1
| │││
||||||
Graph (F)
Graph (C)
D1
|||||
Graph (D)
Graph (G)
Graph (H)
D
* * * *
+++
D1
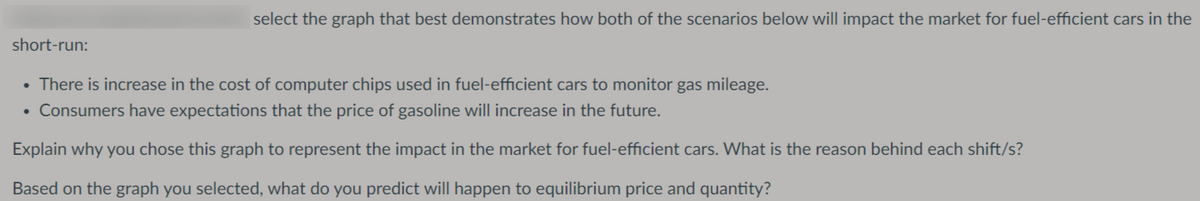
Transcribed Image Text:short-run:
select the graph that best demonstrates how both of the scenarios below will impact the market for fuel-efficient cars in the
• There is increase in the cost of computer chips used in fuel-efficient cars to monitor gas mileage.
• Consumers have expectations that the price of gasoline will increase in the future.
Explain why you chose this graph to represent the impact in the market for fuel-efficient cars. What is the reason behind each shift/s?
Based on the graph you selected, what do you predict will happen to equilibrium price and quantity?
Expert Solution
This question has been solved!
Explore an expertly crafted, step-by-step solution for a thorough understanding of key concepts.

Step by step
Solved in 2 steps

Knowledge Booster


Learn more about
Need a deep-dive on the concept behind this application? Look no further. Learn more about this topic, economics and related others by exploring similar questions and additional content below.Recommended textbooks for you

Principles of Economics (12th Edition)
Economics
ISBN:
9780134078779
Author:
Karl E. Case, Ray C. Fair, Sharon E. Oster
Publisher:
PEARSON

Engineering Economy (17th Edition)
Economics
ISBN:
9780134870069
Author:
William G. Sullivan, Elin M. Wicks, C. Patrick Koelling
Publisher:
PEARSON
Principles of Economics (12th Edition)
Economics
ISBN:
9780134078779
Author:
Karl E. Case, Ray C. Fair, Sharon E. Oster
Publisher:
PEARSON
Engineering Economy (17th Edition)
Economics
ISBN:
9780134870069
Author:
William G. Sullivan, Elin M. Wicks, C. Patrick Koelling
Publisher:
PEARSON

Principles of Economics (MindTap Course List)
Economics
ISBN:
9781305585126
Author:
N. Gregory Mankiw
Publisher:
Cengage Learning

Managerial Economics: A Problem Solving Approach
Economics
ISBN:
9781337106665
Author:
Luke M. Froeb, Brian T. McCann, Michael R. Ward, Mike Shor
Publisher:
Cengage Learning

Managerial Economics & Business Strategy (Mcgraw-…
Economics
ISBN:
9781259290619
Author:
Michael Baye, Jeff Prince
Publisher:
McGraw-Hill Education