Show how to use Hausman Test B₁ B₂ under Ho Consistent, Efficient Consistent, less Efficient under H₁ Inconsistent Consistent
Q: November 2017 Gallup Poll of 10281028 U.S. adults found that 627627 are satisfied with the total…
A: Total =1033 Satisfied = 627 Margin of error = +-4%
Q: The lengths of a particular animal's pregnancies are approximately normally distributed, with mean…
A: Given that μ=267,σ=16
Q: Demand for cars increased by 30% to total of 18% of all cars sold.what is the demand for cars before…
A: It is stated that the demand for cars increased to 18%. The increase in the demand (in percentage)…
Q: One study claimed that 88 % of college students identify themselves as procrastinators. A professor…
A: In testing of hypothesis, a null hypothesis is rejected or accepted based on the value of the test…
Q: K Claim: A minority of adults would erase all of their personal information online if they could. A…
A: Given,sample size(n)=447sample proportion(p^)=0.43
Q: In regression, which of the following answer choices would you use to gauge the relationship…
A: Introduction: Regression provides an understanding of the structure of that association as well as…
Q: Listed below are amounts of strontium-90 (in millibecquerels, or mBq) in a simple random sample…
A: The given data shows the amounts of strontium-90.
Q: a) What proportion of shafts conforms to specifications? b) If the process is centered so that the…
A: Let X denote the diameter of shafts. Given that X follows N(mean = 0.2408, SD = 0.0005), then Z =…
Q: 2. A food truck serves lunch every Tuesday and Thursday on the plaza in front of Van Metre Hall on…
A: The following information has been provided: n=40x¯=145s=17 We need to construct 90% confidence…
Q: Find test statistic Xbar = 23 mean = 20 standard deviation = 10 sample size = 10
A: Given;X¯= 23 mean(μ)= 20 standard deviation(σ)= 10 sample size(n) = 10
Q: 5.40 The effect of changing units. The equation of a regression line, unlike the correla- tion,…
A: Regression line are used to predict the future variable. It explain the relationship between the…
Q: Given below is a data set: 30 23 49 22 32 21 35 35 27 59 57 46 42 43 39 38 26 33 37 25 20 31 36 34…
A:
Q: Q4: The diameter of a shaft in an optical storage drive is normally distributed with mean 0.2408…
A: Given that We have to find a.. Proportion of of shafts conforms to specifications b) If the…
Q: As of January 3, 2019, the US House of Representatives had the following demographics: U.S. House of…
A: Given that, Political Party Republican (B) Democrat (B') Total Gender Male (A) 183…
Q: Standardized Test: You are trying to answer a multiple choice question on a standardized test. There…
A:
Q: The name of your pet is an example of a _____ variable. a. qualitative, b. qauntatative Hotness…
A:
Q: The graph of a normal curve is given on the right. Use the graph to identify the values of μ and σ.
A: Given normal distribution curve is
Q: QL, Python, or Excel to analyze the data. Assume that we want to compare two clinicians, Smith and…
A: Strata Previous MI CHF Shock Clinician Previous MI Rate CHF Rate Shock Rate Probability Length of…
Q: Based on the data below, what is the z-score for a score of 91? 89 86 88 90 90 91 87 89 91 89 87 85…
A: The given data set is, The no.of observations are, n = 70
Q: During one shift, the express lane clerk recorded how many times customers violated the "10 items or…
A: Frequency of times the limit was exceeded by more than 4 items = ?
Q: In regression, the larger (stronger) the correlation between Y and X, the 1. smaller the standard…
A: There is a stronger correlation between Y and X.
Q: A data set includes data from 400 random tornadoes. The display from technology available below…
A: Test is that whether the mean tomado length is greater than 2.6 miles. It is given that Level of…
Q: Use z scores to compare the given values. The tallest living man at one time had a height of 239…
A: Suppose random variable x defines the height of a man.
Q: could you provide the answer in form of fraction thanks
A: Formula : P(A or B or C) = P(A) + P(B)+P(C) Probabilities are given for value of x (0 to 5) We have…
Q: ith respect to correlation, which one of the following statements is false: a.An extreme score can…
A: Question: With respect to correlation, which one of the following statements is false? a.An extreme…
Q: Q3: PVC pipe is manufactured with a mean diameter of 1.01 inch and a standard deviation of 0.003…
A: Mean=1.01, standard deviations=0.003 X~N(Mean=1.01, standard deviations=0.003 )
Q: Suppose the monthly charges for cell phone plans are normally distributed with mean μ=$69 and…
A: (a) Plot the normal curve with the labels.
Q: Assume that blood pressure readings are normally distributed with a mean of 120 and standard…
A: The following information has been provided: Let X be a random variable represents the blood…
Q: Employers were asked what would help them be successful with human resources metrics and reports,…
A: Probability: Probability is the measurement of the probability that an event will occur in a Random…
Q: K A certain drug is used to treat asthma. In a clinical trial of the drug, 21 of 264 treated…
A: Given X=21, n=265 p=8% =0.08 Level of significance ɑ=0.01 Z value=-0.027223275 P…
Q: 1. Ruder Finn, one of the world's largest independent public relations agencies, recently announced…
A: Since you have posted a question with multiple sub-parts, we will solve the first three sub-parts…
Q: Using the 4 weeks of data below, forecast sales for the fifth week using a 3-week weighted moving…
A: From the given data Forecast sales for the fifth week = ?
Q: 12 15 15 16 17 17 18 19 20 (a) Find the low, Q1, median, Q3, and high. b.
A: Given: n = 9 Formula Used: Low = lowest value in the data set. Q1 = n+14thterm Median =…
Q: The above data is: O A. Discrete O B. Continuous O C. Qualitative O D. Nominal
A: Given: A continuous frequency distribution is a series in which the data are classified into…
Q: O Suppose that a random variable X has a continuous distribution for which the probability density…
A:
Q: A university is made up of five schools: Liberal Arts, Sciences, Engineering, Business, and…
A:
Q: The accompanying table describes results from groups of 8 births from 8 different sets of parents.…
A: a. The probability distribution table of 6 girls in 8 births is given.
Q: For this question suppose you want to select a sample of 1000 New Yorkers. 1. If we want our sample…
A:
Q: Frequency 8 6 2 16 21 26 31 data a Based on the above histogram, what is the frequency of the class…
A: The histogram is given.
Q: n the gambling game "craps", a pair of dice is rolled and the outcome of the experiment is the sum…
A: (a) List the sample space for the pair of the dice. The sample space for the pair of the dice is…
Q: e Dollar amount Rent $650 Food $175 Entertainment $100 Bills $91 Charitable donations $100
A: Jalen's net income for the month of May is 1,600. Expense Dollar Rent 650 Food 175…
Q: The number of chocolate chips in an 18-ounce bag of chocolate chip cookies is approximately…
A:
Q: 1. The departures from the simple linear model with normal errors using residuals follows. 1. The…
A: Given the departures from the linear model with normal errors using residual : The regression…
Q: Find the mean of the data summarized in the given frequency distribution. Compare the computed mean…
A: Introduction: The actual mean of the data set is 58.6 degrees Fahrenheit or 58.6°F. It is required…
Q: If a 45- to 48-year-old mother who had a live birth in 2015 is randomly selected, how many live…
A: Given that: The graph of discrete probability provided represents the number of live births by a…
Q: Suppose the probability of an IRS audit is 2.9 percent for U.S. taxpayers who file form 1040 and who…
A: Given that p = 2.9% = 0.029 , q = 1 - p = 1 - 0.029 = 0.971 p = The probability of an IRS audit
Q: Q2: The number of cracks in a section of interstate highway that are significant enough to require…
A: Given that We have to find a.. The probability that there are no cracks that require repair in 4…
Q: Explain what the following two formulas are used for and why both are needed. O: Σ(x - μ) N VS. S =…
A: Given farmula
Q: This is very helpful, thank you! Could you please share the excel fomulas used to acheve this?
A: The given data is entered in excel as shown below
Q: Annual Cost of College. The increasing annual cost (including tuition, room, board, books, and fees)…
A: In the parametric test, the population follows the assumption of any distribution. If the population…
Can you explain the formulas and how to use it?
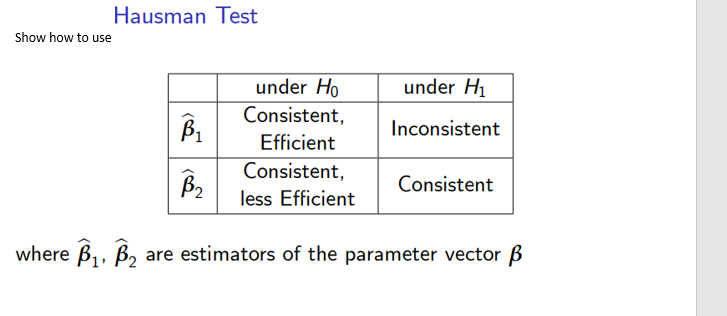
Step by step
Solved in 2 steps
- Give an example of a linear combination that resulted in the zero vector that did NOT have 0's for the weights.Let x and y be linearly independent vectors in R2.If | |x | |= 2 and | |y | | = 3, what, if anything, can weconclude about the possible values of |xTy|?Find basis for the set of vectors in R2 on the line y= nx . where n=9.