Show the effects of the $60 tariff on the following graph. Use the black line (plus symbol) to indicate the world price plus the tariff. Then, use the green triangle (triangle symbols) to show the consumer surplus with the tariff and the purple triangle (diamond symbols) to show the producer surplus with the tariff. Lastly, use the orange quadrilateral (square symbols) to shade the area representing government revenue received from the tariff and the tan triangles (dash symbols) to shade the areas representing the net loss or deadweight loss (DWL) caused by the tariff. Domestic Supply 490 Domestic Demand 460 World Price Plus Tariff 430 400 370 CS 340 310 PS 280 Pw 250 Government Revenue 220 190 10 15 20 25 30 35 40 45 50 DWL QUANTITY (Thousands of tons of wheat) PRICE (Dollars per ton)
Show the effects of the $60 tariff on the following graph. Use the black line (plus symbol) to indicate the world price plus the tariff. Then, use the green triangle (triangle symbols) to show the consumer surplus with the tariff and the purple triangle (diamond symbols) to show the producer surplus with the tariff. Lastly, use the orange quadrilateral (square symbols) to shade the area representing government revenue received from the tariff and the tan triangles (dash symbols) to shade the areas representing the net loss or deadweight loss (DWL) caused by the tariff. Domestic Supply 490 Domestic Demand 460 World Price Plus Tariff 430 400 370 CS 340 310 PS 280 Pw 250 Government Revenue 220 190 10 15 20 25 30 35 40 45 50 DWL QUANTITY (Thousands of tons of wheat) PRICE (Dollars per ton)

Chapter21: International Trade
Section: Chapter Questions
Problem 2WNG

Related questions
Question
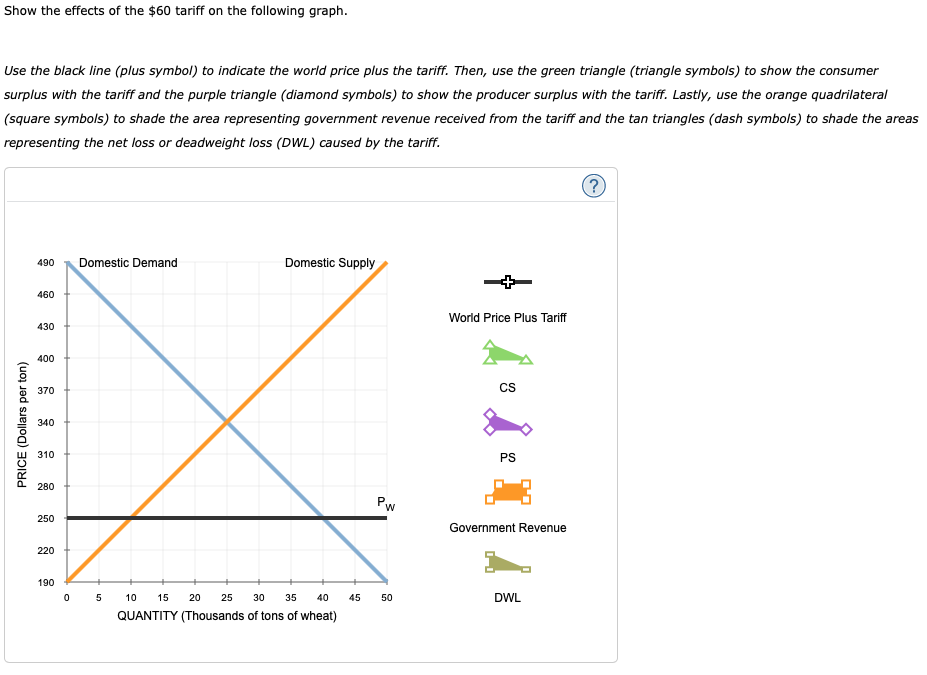
Transcribed Image Text:Show the effects of the $60 tariff on the following graph.
Use the black line (plus symbol) to indicate the world price plus the tariff. Then, use the green triangle (triangle symbols) to show the consumer
surplus with the tariff and the purple triangle (diamond symbols) to show the producer surplus with the tariff. Lastly, use the orange quadrilateral
(square symbols) to shade the area representing government revenue received from the tariff and the tan triangles (dash symbols) to shade the areas
representing the net loss or deadweight loss (DWL) caused by the tariff.
Domestic Supply
490
Domestic Demand
460
World Price Plus Tariff
430
400
370
CS
340
310
PS
280
Pw
250
Government Revenue
220
190
10
15
20 25
30
35
40
45
50
DWL
QUANTITY (Thousands of tons of wheat)
PRICE (Dollars per ton)
Expert Solution
This question has been solved!
Explore an expertly crafted, step-by-step solution for a thorough understanding of key concepts.

This is a popular solution!

Trending now
This is a popular solution!

Step by step
Solved in 3 steps with 1 images

Recommended textbooks for you

Economics (MindTap Course List)
Economics
ISBN:
9781337617383
Author:
Roger A. Arnold
Publisher:
Cengage Learning

Economics (MindTap Course List)
Economics
ISBN:
9781337617383
Author:
Roger A. Arnold
Publisher:
Cengage Learning

Exploring Economics
Economics
ISBN:
9781544336329
Author:
Robert L. Sexton
Publisher:
SAGE Publications, Inc

