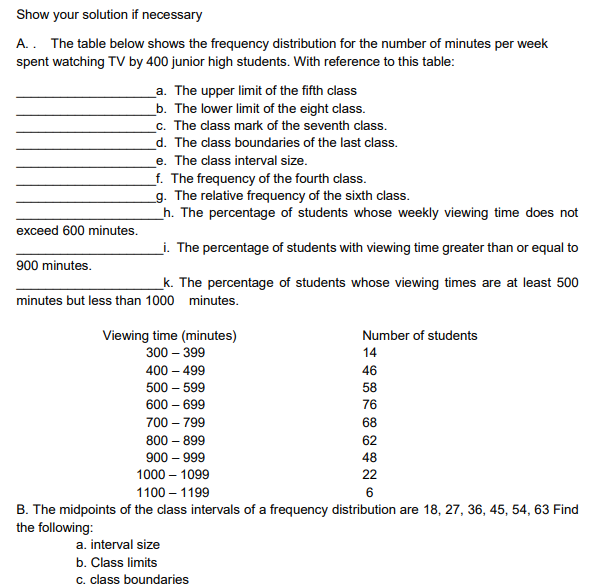
Show your solution if necessary A.. The table below shows the frequency distribution for the number of minutes per week spent watching TV by 400 junior high students. With reference to this table: _a. The upper limit of the fifth class _b. The lower limit of the eight class. _c. The class mark of the seventh class. d. The class boundaries of the last class. e. The class interval size. _f. The frequency of the fourth class. _g. The relative frequency of the sixth class. h. The percentage of students whose weekly viewing time does not exceed 600 minutes. _i. The percentage of students with viewing time greater than or equal to 900 minutes. _k. The percentage of students whose viewing times are at least 500 minutes but less than 1000 minutes.
Show your solution if necessary A.. The table below shows the frequency distribution for the number of minutes per week spent watching TV by 400 junior high students. With reference to this table: _a. The upper limit of the fifth class _b. The lower limit of the eight class. _c. The class mark of the seventh class. d. The class boundaries of the last class. e. The class interval size. _f. The frequency of the fourth class. _g. The relative frequency of the sixth class. h. The percentage of students whose weekly viewing time does not exceed 600 minutes. _i. The percentage of students with viewing time greater than or equal to 900 minutes. _k. The percentage of students whose viewing times are at least 500 minutes but less than 1000 minutes.

Glencoe Algebra 1, Student Edition, 9780079039897, 0079039898, 2018
18th Edition
ISBN:9780079039897
Author:Carter
Publisher:Carter
Chapter10: Statistics
Section10.5: Comparing Sets Of Data
Problem 26PFA

Related questions
Question
Transcribed Image Text:Show your solution if necessary
A.. The table below shows the frequency distribution for the number of minutes per week
spent watching TV by 400 junior high students. With reference to this table:
_a. The upper limit of the fifth class
_b. The lower limit of the eight class.
c. The class mark of the seventh class.
_d. The class boundaries of the last class.
_e. The class interval size.
_f. The frequency of the fourth class.
g. The relative frequency of the sixth class.
_h. The percentage of students whose weekly viewing time does not
exceed 600 minutes.
_i. The percentage of students with viewing time greater than or equal to
900 minutes.
k. The percentage of students whose viewing times are at least 500
minutes but less than 1000 minutes.
Viewing time (minutes)
Number of students
300 – 399
14
400 – 499
46
500 – 599
58
600 – 699
76
700 – 799
68
800 – 899
62
900 – 999
48
1000 – 1099
22
1100 – 1199
6
B. The midpoints of the class intervals of a frequency distribution are 18, 27, 36, 45, 54, 63 Find
the following:
a. interval size
b. Class limits
c. class boundaries
Expert Solution
This question has been solved!
Explore an expertly crafted, step-by-step solution for a thorough understanding of key concepts.

Step by step
Solved in 4 steps with 1 images

Recommended textbooks for you
Glencoe Algebra 1, Student Edition, 9780079039897…
Algebra
ISBN:
9780079039897
Author:
Carter
Publisher:
McGraw Hill

Holt Mcdougal Larson Pre-algebra: Student Edition…
Algebra
ISBN:
9780547587776
Author:
HOLT MCDOUGAL
Publisher:
HOLT MCDOUGAL
Glencoe Algebra 1, Student Edition, 9780079039897…
Algebra
ISBN:
9780079039897
Author:
Carter
Publisher:
McGraw Hill
Holt Mcdougal Larson Pre-algebra: Student Edition…
Algebra
ISBN:
9780547587776
Author:
HOLT MCDOUGAL
Publisher:
HOLT MCDOUGAL