Since elderly people may have difficulty standing straight, a study aims to predict overall height from height to the knee. Here are data (in centimeters, cm) for five elderly men. Knee Height (cm) 57.7 47.4 43.5 44.8 Overall Height(cm) 192.1 153.3 146.4 162.7 Let's assume a regression model Overall height = Bo + B₁ x Knee height + 1. Which R command should you use to fit the model if you have defined variables as knee = c(57.7, 47.4, 43.5, 44.8, 55.2) overall = c(192.1, 153.3, 146.4, 162.7, 169.1) 55.2 169.1 (a) 1m (knee ~ overall) (b) lm (overall ~ knee) (c) t.test(overall, knee) (d) t.test (knee, overall)
Since elderly people may have difficulty standing straight, a study aims to predict overall height from height to the knee. Here are data (in centimeters, cm) for five elderly men. Knee Height (cm) 57.7 47.4 43.5 44.8 Overall Height(cm) 192.1 153.3 146.4 162.7 Let's assume a regression model Overall height = Bo + B₁ x Knee height + 1. Which R command should you use to fit the model if you have defined variables as knee = c(57.7, 47.4, 43.5, 44.8, 55.2) overall = c(192.1, 153.3, 146.4, 162.7, 169.1) 55.2 169.1 (a) 1m (knee ~ overall) (b) lm (overall ~ knee) (c) t.test(overall, knee) (d) t.test (knee, overall)

Linear Algebra: A Modern Introduction
4th Edition
ISBN:9781285463247
Author:David Poole
Publisher:David Poole
Chapter7: Distance And Approximation
Section7.3: Least Squares Approximation
Problem 31EQ

Related questions
Question
Please solve both subparts of the question. Part 1 is one image and part 2 is the other one. Thanks!
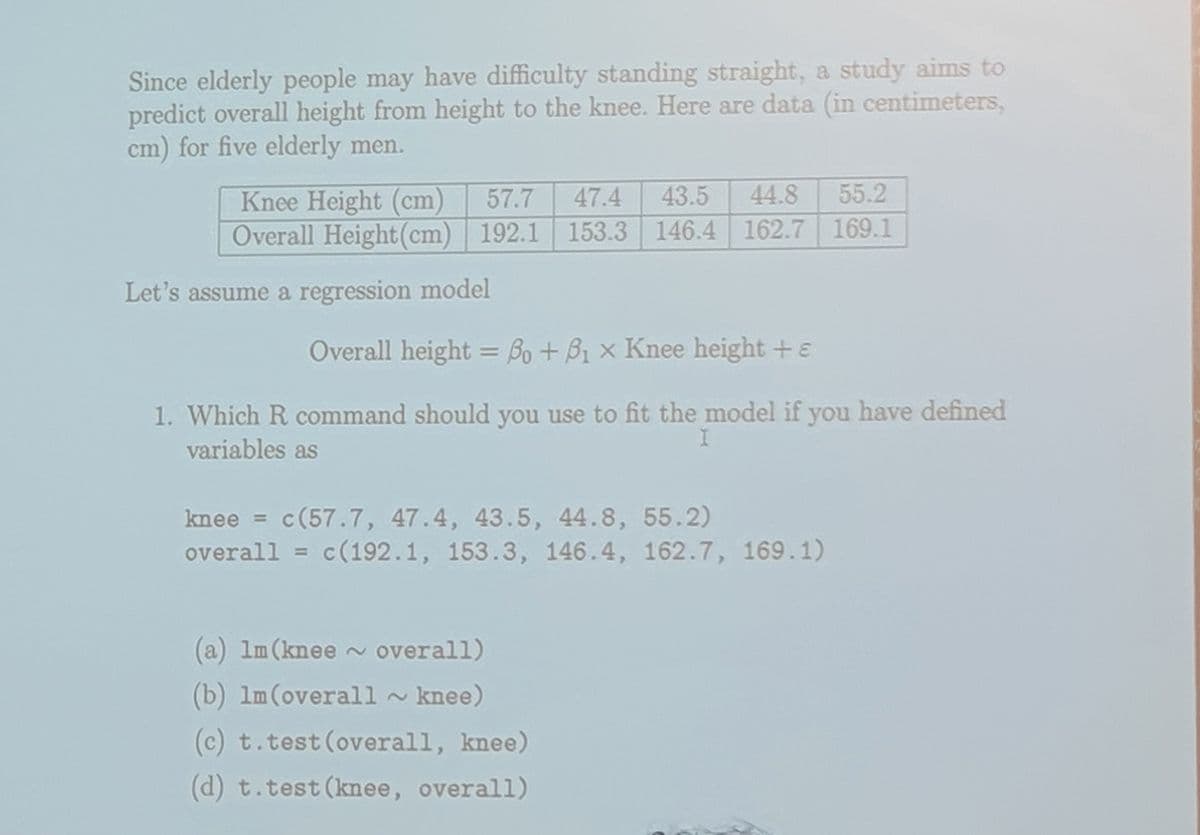
Transcribed Image Text:Since elderly people may have difficulty standing straight, a study aims to
predict overall height from height to the knee. Here are data (in centimeters,
cm) for five elderly men.
Knee Height (cm) 57.7 47.4 43.5 44.8
Overall Height (cm) 192.1
192.1 153.3 146.4 162.7
Let's assume a regression model
Overall height = Bo + B₁ x Knee height + e
1. Which R command should you use to fit the model if you have defined
variables as
I
knee = c(57.7, 47.4, 43.5, 44.8, 55.2)
overall = c(192.1, 153.3, 146.4, 162.7, 169.1)
(a) 1m (knee overall)
(b) lm (overall ~ knee)
(c) t.test(overall, knee)
(d) t.test (knee, overall)
55.2
169.1
~
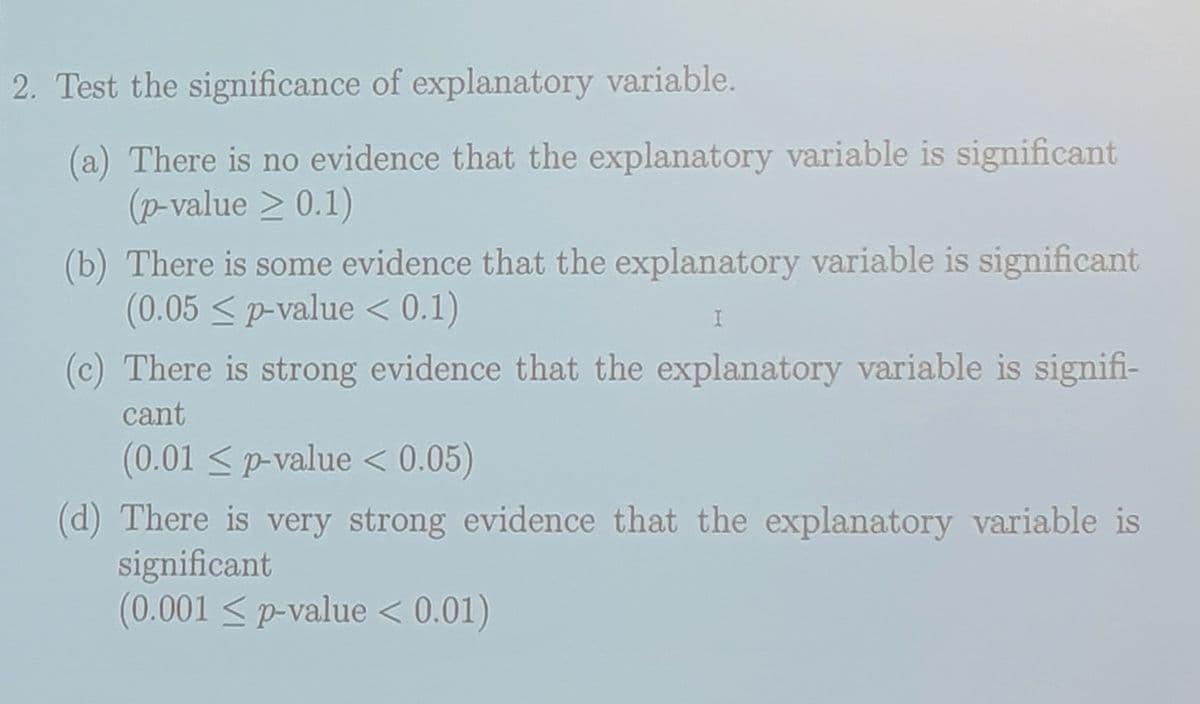
Transcribed Image Text:2. Test the significance of explanatory variable.
(a) There is no evidence that the explanatory variable is significant
(p-value 20.1)
(b) There is some evidence that the explanatory variable is significant
(0.05 ≤ p-value < 0.1)
I
(c) There is strong evidence that the explanatory variable is signifi-
cant
(0.01 ≤ p-value < 0.05)
(d) There is very strong evidence that the explanatory variable is
significant
(0.001 ≤ p-value < 0.01)
Expert Solution
This question has been solved!
Explore an expertly crafted, step-by-step solution for a thorough understanding of key concepts.

This is a popular solution!

Trending now
This is a popular solution!

Step by step
Solved in 2 steps

Recommended textbooks for you
Linear Algebra: A Modern Introduction
Algebra
ISBN:
9781285463247
Author:
David Poole
Publisher:
Cengage Learning

College Algebra
Algebra
ISBN:
9781305115545
Author:
James Stewart, Lothar Redlin, Saleem Watson
Publisher:
Cengage Learning

Glencoe Algebra 1, Student Edition, 9780079039897…
Algebra
ISBN:
9780079039897
Author:
Carter
Publisher:
McGraw Hill
Linear Algebra: A Modern Introduction
Algebra
ISBN:
9781285463247
Author:
David Poole
Publisher:
Cengage Learning
College Algebra
Algebra
ISBN:
9781305115545
Author:
James Stewart, Lothar Redlin, Saleem Watson
Publisher:
Cengage Learning
Glencoe Algebra 1, Student Edition, 9780079039897…
Algebra
ISBN:
9780079039897
Author:
Carter
Publisher:
McGraw Hill