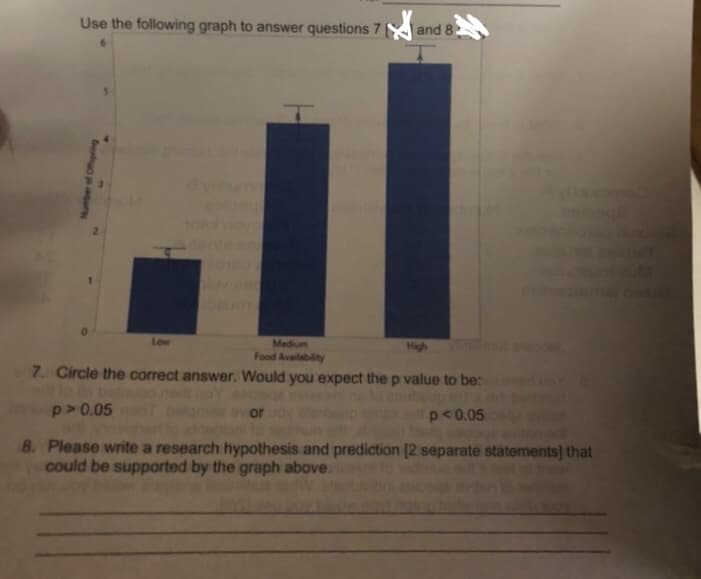
Food Availability 7. Circle the correct answer. Would you expect the p value to be: p> 0.05 p<0.05 8. Please write a research hypothesis and prediction [2 separate statements) that could be supported by the graph above.


Q: Question 3 Adult respiratory distress syndrome (ARDS) is a complication in many critically ill…
A: As per our guidelines I can solve only first three subparts. Kindly post the remaining subparts…
Q: The statistics prompt states "The average amount of sleep people get throughout the week in hours.…
A: Hello! Thank you for your query. We provide a solution by using one example. Let X be the average…
Q: Data Set 37 "Cola Weights and Volumes" in Appendix B includes volumes (ounces) of a sample of cans…
A:
Q: On the basis of extensive tests, the yield point of a particular type of mild steel-reinforcing bar…
A: Given x-bar=8407 Standard deviations=100 n=25
Q: If I expect that there will be an effect of some variable (say, study method) when ignoring the…
A: Main Effect: Main effect is the effect of levels of one factor in the study by ignoring the effects…
Q: Suppose that males between the ages of 40 and 49 eat on average 103.8 g of fat every day with a…
A: Given Mean=103.8 Standard deviations=4.02
Q: Female Physicians The percentage of physicians who are women is 27.9%. In a survey of physicians…
A: Given p=0.279, level of significance ɑ=0.01, X=44, n=114
Q: A psychologist would like to know whether the season (autumn, winter, spring, and summer) has any…
A: The question is about ANOVA Given : F = 3.63 SSWithin = 473.44 Total no. of seasons ( k ) = 4 Random…
Q: Suppose a regression model with 34 observations was specified as: y = Bo + B₁₁+ B₂x₂ + B ₂x3 + B₁ 4…
A: Given that: The multiple regression equation is given as:…
Q: What is the mode of the following data set 4, 6, 5, 3, 5, 8, 7, 3, 7, 6, and 3? a. 6 b. 7 c. 5 d. 3
A: Followings are the Explanation of the question let Consider the X = 4, 6, 5, 3, 5, 8, 7, 3, 7, 6, 3…
Q: Elephants are the mammals with the longest gestation period. One species of elephant has a mean…
A: Given,standard deviation(σ)=63 days
Q: Market research participants could be selected in a by putting all names into a bowl, mixing them…
A: Given that, Market research participants could be selected in a by putting all names into a bowl,…
Q: A survey of 366 Cook County residents is conducted, in which 253 of the respondents had shopped…
A: Given: n = 366 X = 253 Formula Used: Confidence Interval = p^ ± Z*p^(1-p^)n
Q: Assume that the probability of a being born with Genetic Condition B is p = 7/60. A study looks at a…
A: given data, p=760n=826we have to find out the mean , standard deviation and range rule of thumb…
Q: Which of the following is/are TRUE at 5% level of significance? I. We can assume independence of…
A: Given that Which of the following is/are TRUE at 5% level of significance? I. We can assume…
Q: 1. Find the correlation coefficient using Spearman rho and interpret results. Road width in feet (x)…
A:
Q: A university is trying to determine whether its students would prefer improvements to the school's…
A: Given that, A university ia trying to determine whether it's students would prefer improvements to…
Q: 4. Suppose that X₁, X2,..., Xn and Y₁, Y2,..., Yn are independent random samples of size n from…
A:
Q: An industrial plant wants to determine which of two types of fuel, electric or gas, is more cost…
A: There are two independent samples which are electricity and gas. We have to test whether the mean…
Q: Based on their records, a hospital claims that the proportion, p, of full-term babies born in the…
A: given data claim : p = 0.44n = 175x = 89α = 0.01
Q: IQ is known to be normally distributed with a mean of 100 and standard deviation of 15. If a sample…
A: Given Information: Mean μ=100 Standard deviation σ=15 Sample mean x¯=85 Sample size n=25
Q: Use the graph to the right to answers parts a and b. a. For the normal distribution shown to the…
A: Given Right tail probability=0.16
Q: the Lakers beat the Heat in the NBA championship. Beth is a Lakers fan. Alex is Heat fan. Even…
A: Here, the test is conducted to check which team had the better players during the regular season in…
Q: Recycling Approximately 70% of the U.S. population recycles. According to a green survey of a random…
A: a) Suppose p is the true proportion of college students, who recycle.
Q: Faked numbers in tax returns, invoices, or expense account claims often display patterns that are…
A: Suppose a random variable x defines the first digit of a randomly chosen legitimate record.
Q: The research scenario states: decide to look at whether there is a difference between the average…
A: Given the research scenario: decide to look at whether there is a difference between the average…
Q: (a) What is the probability that 0, 1, 2, and 3 access lines will be in use? (Round your answers to…
A: by bartkeby policy i can gives only 3 subparts answer From given data we have : Mean of λ=33 call…
Q: If a is chosen by the analyst to be .025 and x = 14.15 with 4 degrees of freedom, what is our…
A: Given -: x² statistic =14.15 Degrees of freedom, df = 4
Q: Listed below are speeds (mi/h) measured from traffic on a busy highway. This simple random sample…
A: Given n=12 98% confidence interval
Q: Find the mean of the data summarized in the given frequency distribution. Compare the computed mean…
A: class f midpoint(x) fx 42-45 22 43.5 957 46-49 13 47.5 617.5 50-53 6 51.5 309 54-57 3 55.5…
Q: Your mail-order company advertises that it ships 90% of its orders within three working days. You…
A: Given: P = 0.90 n = 100 Formula Used: Z = p^-Pσ Where, σ = P(1-P)n
Q: ) State whether the following is a discrete or continuous random variable. i. Number of seeds in…
A: Anything which can be represented in the form is considered as continuous and if it is only…
Q: Express the confidence interval (0.0847, 0.1530) in the form p± E
A: given data, confidence interval (0.0847, 0.1530)here we have to express the confidence interval in…
Q: A researcher rcher believes that the mean earnings of top-paid actors, athletes and musicians are…
A: Here we’ve to compare 3 group means so we use ANOVA. Let A represents group of Actor, B represents…
Q: ut of all families with 4 children, you select one family at random. What are the chances that the…
A: GIVEN DATA, out of all families 4 children , you select one family at randomprobability the family…
Q: he probability of type I error if exactly 60% of the voters favor the use of these fuels. extbook…
A: Given x=315 n=500
Q: Listed below are prices in dollars for one night at different hotels in a certain region. Find the…
A: arrange data in accending order 82,146,193,203,240,243,273,300 x x2 82 6724 146 21316…
Q: Decide whether the normal sampling distribution can be used. If it can be used, test the claim about…
A: Given: n = 100 p^ = 0.25 P = 0.29 α = 0.05 Formula Used: Test-statistic Z = p^-PP(1-P)n
Q: The following stem-and leaf display shows the weight, in kilogram, boxes of juice Stem-and-Leaf…
A:
Q: Participant Identification 1 2 3 4 5 6 7 8 9 10 Mean SD Correlational Design Extraversion Score 20…
A: Given Information: Extraversion Score Interaction Behavior 20 8 10 2 18 10 18 3 19 8…
Q: Employees in a company experience distractions (phone calls, emails, unscheduled visits "etc".)…
A: Given that, The distraction times are right skewed with a mean of 95 minutes and standard deviation…
Q: In 2020, the Lakers beat the Heat in the NBA championship. Beth is a Lakers fan. Alex is Heat fan.…
A: To analyze which team Lakers or Heat had better players during the regular season in 2020, one can…
Q: A university is applying classification methods in order to identify alumni who may be interested in…
A:
Q: Life on Other Planets Forty-six percent of people believe that there is life on other planets in the…
A: Givensample size(n)=100x=40sample proportion(p^)=xn=40100=0.40significance level=0.01
Q: This regression equation is used to test for market timing ability: rpt - Ft= a + b(rMt - rFt) +…
A:
Q: 1. One thousand two hundred and seventy deer are living on an island that is eight hundred and…
A:
Q: Answer Questions 24-29 using the following additional information: A raft in the TRRR has six…
A: 24. Given that Xi~Nμ,σ2. There are 6 samples selected from X, that is, n=6. From the central limit…
Q: You wish to test the following claim using a significance level of α=0.05. H0: π =0.26…
A: Given that You wish to test the following claim using a significance level of α=0.05. H0: π…
Q: The table below shows the annual return of an investor over a 5 year period. 2017 2018 2019 2020…
A: Mean = ΣXi/n Here sample size is n= 5 Mean = (15+18+20-2+3)/5 =54/5 =10.8%The mean of return is…
Q: The data in the table represent the tuition for all 2-year community colleges in a region in…
A: From given data we have :

Step by step
Solved in 3 steps with 1 images

- In a poll, a random sample of 2163 adults (aged 18 and over) was asked, "When you see an ad emphasizing that a product is made in your country, are you more likely to buy it, less likely to buy it, or neither more nor less likely to buy it?" The results of the survey are presented in the side-by-side graph. Complete parts (a) through (d) below. (a) What proportion of 18- to 34-year-old respondents are more likely to buy when made in their country? What proportion of 35- to 44-year-old respondents are more likely to buy when made in their country? The proportion of 18- to 34-year-old respondents is enter your response here. The proportion of 35- to 44-year-old respondents is enter your response here. Part 2 (b) What age group has the greatest proportion who are more likely to buy when made in their country? A. 55+ yrs B. 35-44 yrs C. 18-34 yrs D. 45-54 yrs Part 3 (c) Which age group has a majority of respondents who…Below is the graph of ?(?). Determine the followingImage AttachedThis bargraph attached illustrates the responses of different age groups to the following inquiry: "Over the past week, how often did you maintain the recommended 2-meter COVID social distance rule?" What ONE of the below options can be inferred from the graph? a) The plot reveals that a majority of individuals across all age groups tend to practice 2-meter social distancing at least some of the time. b) It indicates that the likelihood of adhering to 2-meter social distancing tends to increase with age. c)The plot suggests a correlation between age groups and the adherence to 2-meter social distancing. d) Notably, a considerable number of adults aged 55 to 64 do not maintain a 2-meter social distance.
- Indicate which of the following hypotheses are one or two tailed and if one tailed, , indicate which side of the graph the tail would be found:a. Giving anti-anxiety medication to Alzheimer patients will change the number of attacks they have.b. Eating healthy food will reduce depressionc. Adding pictures to textbooks will modify the student’s gradesd. Taking a weight loss drug will vary individuals’ weightFor each problem, write which test you used in your calculator, draw the graph, calculate pvalue, and write your conclusion in a complete sentence.Mars Inc., makers of M&M candies, claims that they produce M&Ms with the following color distribution: Brown: 30% Red: 20% Yellow: 20% Orange: 10% Green: 10% Blue 10% A SRS of M&Ms bags were selected from the grocery store shelf and produced the following color counts: Brown: 120 Red: 57 Yellow: 63 Orange: 42 Green: 27 Blue: 21 Conduct a hypothesis test to see if the manufacturer’s claim for the proportion of orange M&Ms is correct.Part D indicates a answer choice on picking between which of the graphs fit for it.
- Please the passage on SAT scores and then answer the questions below to get the correct labels on the graph.Given the following graph, which of the following statements is true about the senator's approval rating?A glass manufacturing company wanted to investigate the effect of breakoff pressure and stopper height on the percentage of breaking off chips. The results are in the accompanying table. Complete parts (a) through (e). a. At the 0.01 level of significance is there an interaction between the breakoff pressure and the stopper height? b. is there an effect due to the breakoff pressure? c. is there an effect due to the stopper height? d. Plot the percentage breakoff for each breakoff pressure for each stopper height. e. Discuss the results of (a) through (d).
