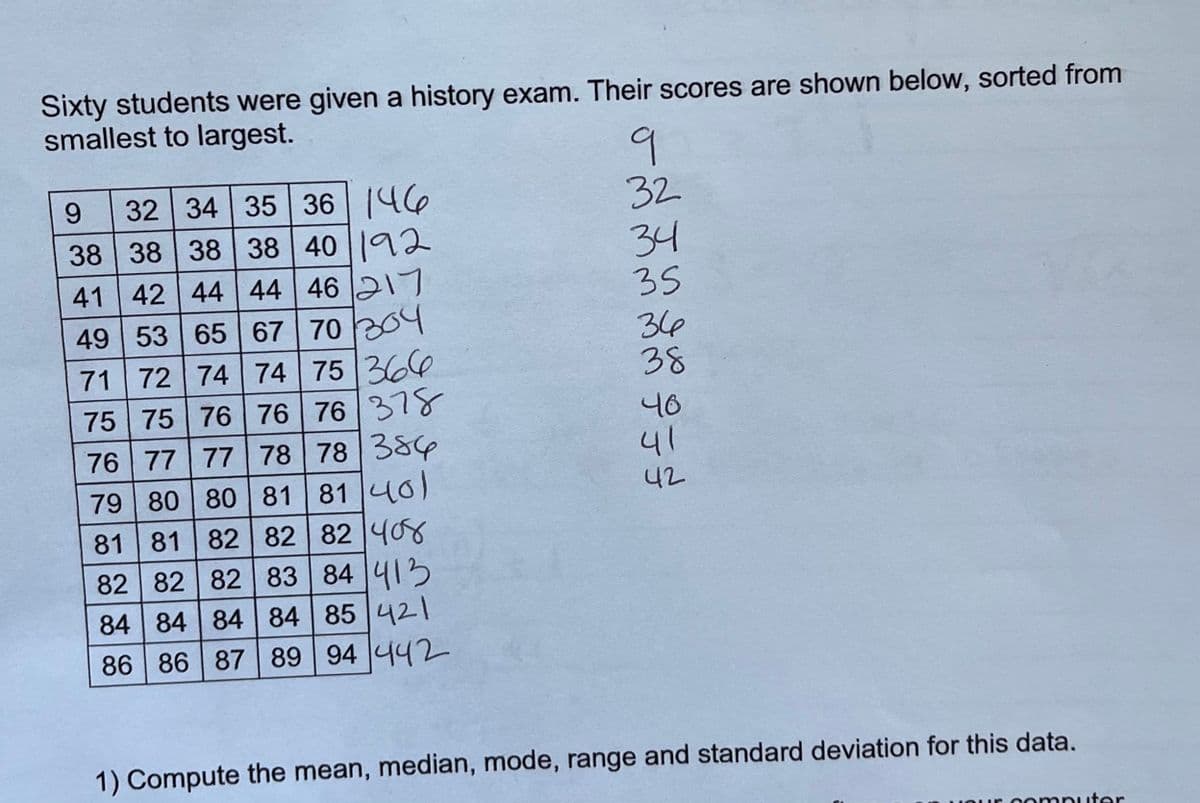
Sixty students were given a history exam. Their scores are shown below, sorted from smallest to largest. 9 32 34 35 32 34 35 36 46 38 38 38 38 40 92 41 42 44 44 46 217 49 53 65 67 70 204 71 72 74 74 75 366 76 378 76 77 77 78 78 384 79 80 80 81 81 40) 82 82 82 408 82 82 82 83 84 413 84 84 84 84 85 421 86 86 87 89 94 442 38 75 75 76 76 40 41 42 81 81 1) Compute the mean, median, mode, range and standard deviation for this data.


Inverse Normal Distribution
The method used for finding the corresponding z-critical value in a normal distribution using the known probability is said to be an inverse normal distribution. The inverse normal distribution is a continuous probability distribution with a family of two parameters.
Mean, Median, Mode
It is a descriptive summary of a data set. It can be defined by using some of the measures. The central tendencies do not provide information regarding individual data from the dataset. However, they give a summary of the data set. The central tendency or measure of central tendency is a central or typical value for a probability distribution.
Z-Scores
A z-score is a unit of measurement used in statistics to describe the position of a raw score in terms of its distance from the mean, measured with reference to standard deviation from the mean. Z-scores are useful in statistics because they allow comparison between two scores that belong to different normal distributions.
Can someone please help me compute the mean, median,
**For decimals round to the nearest tenths.
thank you!


Trending now
This is a popular solution!

Step by step
Solved in 2 steps with 1 images


