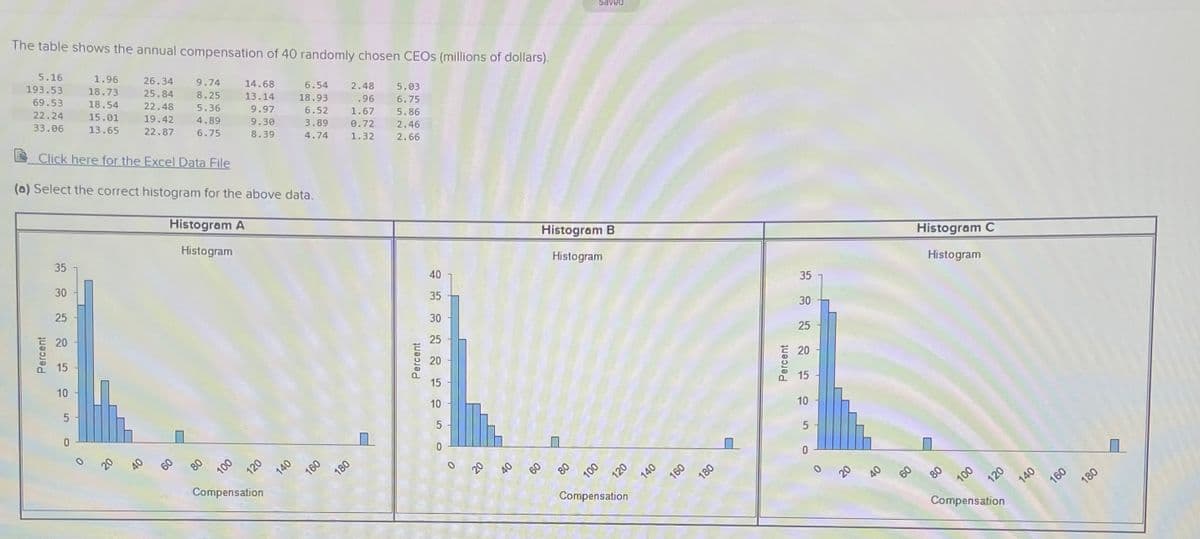
The table shows the annual compensation of 40 randomly chosen CEOS (millions of dollars). 5.16 193.53 69.53 1.96 18.73 18.54 15.01 26.34 25.84 9.74 14.68 22.24 22.48 8.25 6.54 13.14 2.48 5.36 18.93 5.03 6.75 33.06 19.42 22.87 13.65 9.97 96 4.89 6.52 9.30 8.39 1.67 6.75 E Click here for the Excel Data File 5.86 2.46 3.89 e.72 4.74 1.32 2.66 (0) Select the correct histogram for the above data. Histogram A 35 Histogram Histogram B 30 40 Histogram 25 Histogram C 35 20 Histogram 30 35 15 25 30 10 20 25 15 20 10 a 15 10 100 140 160 Compensation 180 80 120 140 100 Compensation 180 140 Compensation 100 160 180 120 Percent 120 Percent 091 Percent
The table shows the annual compensation of 40 randomly chosen CEOS (millions of dollars). 5.16 193.53 69.53 1.96 18.73 18.54 15.01 26.34 25.84 9.74 14.68 22.24 22.48 8.25 6.54 13.14 2.48 5.36 18.93 5.03 6.75 33.06 19.42 22.87 13.65 9.97 96 4.89 6.52 9.30 8.39 1.67 6.75 E Click here for the Excel Data File 5.86 2.46 3.89 e.72 4.74 1.32 2.66 (0) Select the correct histogram for the above data. Histogram A 35 Histogram Histogram B 30 40 Histogram 25 Histogram C 35 20 Histogram 30 35 15 25 30 10 20 25 15 20 10 a 15 10 100 140 160 Compensation 180 80 120 140 100 Compensation 180 140 Compensation 100 160 180 120 Percent 120 Percent 091 Percent

Glencoe Algebra 1, Student Edition, 9780079039897, 0079039898, 2018
18th Edition
ISBN:9780079039897
Author:Carter
Publisher:Carter
Chapter10: Statistics
Section10.6: Summarizing Categorical Data
Problem 30PPS

Related questions
Question
Please see attachments below
Transcribed Image Text:The table shows the annual compensation of 40 randomly chosen CEOS (millions of dollars).
Saved
5.16
1.96
193.53
26.34
18.73
9.74
69.53
25.84
14.68
22.24
18.54
8.25
6.54
15.01
22.48
13.14
2.48
5.03
5.36
18.93
33.06
19.42
9.97
.96
6.75
13.65
4.89
6.52
22.87
9.30
1.67
5.86
6.75
3.89
Click here for the Excel Data File
8.39
0.72
4.74
2.46
1.32
2.66
(a) Select the correct histogram for the above data.
Histogram A
35
Histogram
Histogram B
30
Histogram
40
Histogram C
25
35
Histogram
20
35
30
15
30
25
10
20
25
15
20
10
15
10
80
140
Compensation
160
180
20
80
0.
160
180
Compensation
60
100
120
140
160
Compensation
180
Percent
120
Percent
120
140
Percent
09.
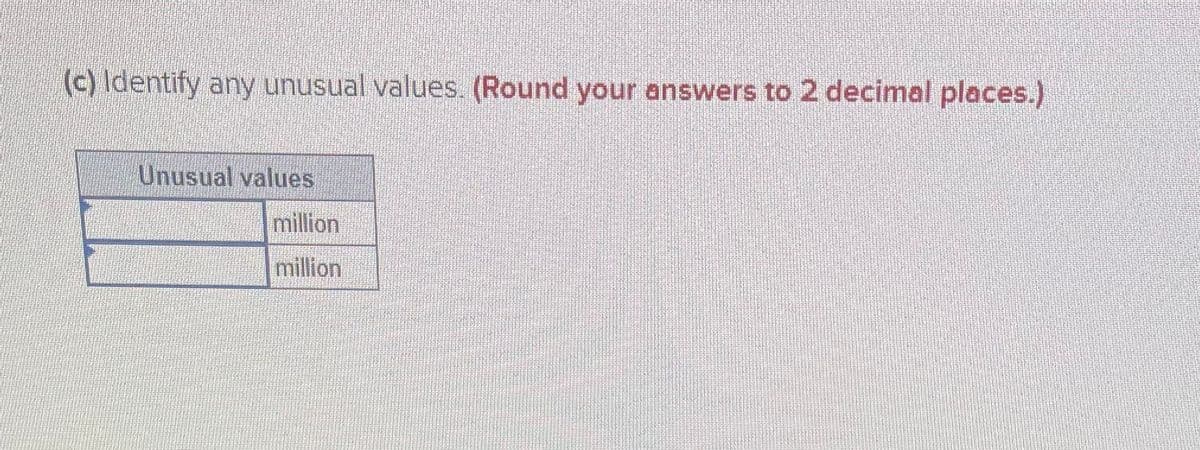
Transcribed Image Text:(c) Identify any unusual values. (Round your answers to 2 decimal places.)
Unusual values
million
million
Expert Solution
This question has been solved!
Explore an expertly crafted, step-by-step solution for a thorough understanding of key concepts.

This is a popular solution!

Trending now
This is a popular solution!

Step by step
Solved in 3 steps with 1 images

Recommended textbooks for you
Glencoe Algebra 1, Student Edition, 9780079039897…
Algebra
ISBN:
9780079039897
Author:
Carter
Publisher:
McGraw Hill

Holt Mcdougal Larson Pre-algebra: Student Edition…
Algebra
ISBN:
9780547587776
Author:
HOLT MCDOUGAL
Publisher:
HOLT MCDOUGAL

Algebra & Trigonometry with Analytic Geometry
Algebra
ISBN:
9781133382119
Author:
Swokowski
Publisher:
Cengage
Glencoe Algebra 1, Student Edition, 9780079039897…
Algebra
ISBN:
9780079039897
Author:
Carter
Publisher:
McGraw Hill
Holt Mcdougal Larson Pre-algebra: Student Edition…
Algebra
ISBN:
9780547587776
Author:
HOLT MCDOUGAL
Publisher:
HOLT MCDOUGAL
Algebra & Trigonometry with Analytic Geometry
Algebra
ISBN:
9781133382119
Author:
Swokowski
Publisher:
Cengage