Sketch a normal curve for the probability density function. Label the horizontal axis with values of 20, 30, 40, 50, 60, 70, and 80. 20 20 30 40 50 60 40 60 70 80 80 70 50 30 80 70 30 50 60 50 40 30 20 70 80 60 40 20 (b) What is the probability the random variable will assume a value between 20 and 80? (Round your answer to three decimal places.) (c) What is the probability the random variable will assume a value between 40 and 60? (Round your answer to three decimal places.)
Sketch a normal curve for the probability density function. Label the horizontal axis with values of 20, 30, 40, 50, 60, 70, and 80. 20 20 30 40 50 60 40 60 70 80 80 70 50 30 80 70 30 50 60 50 40 30 20 70 80 60 40 20 (b) What is the probability the random variable will assume a value between 20 and 80? (Round your answer to three decimal places.) (c) What is the probability the random variable will assume a value between 40 and 60? (Round your answer to three decimal places.)

Algebra & Trigonometry with Analytic Geometry
13th Edition
ISBN:9781133382119
Author:Swokowski
Publisher:Swokowski
Chapter10: Sequences, Series, And Probability
Section10.8: Probability
Problem 10E

Related questions
Question
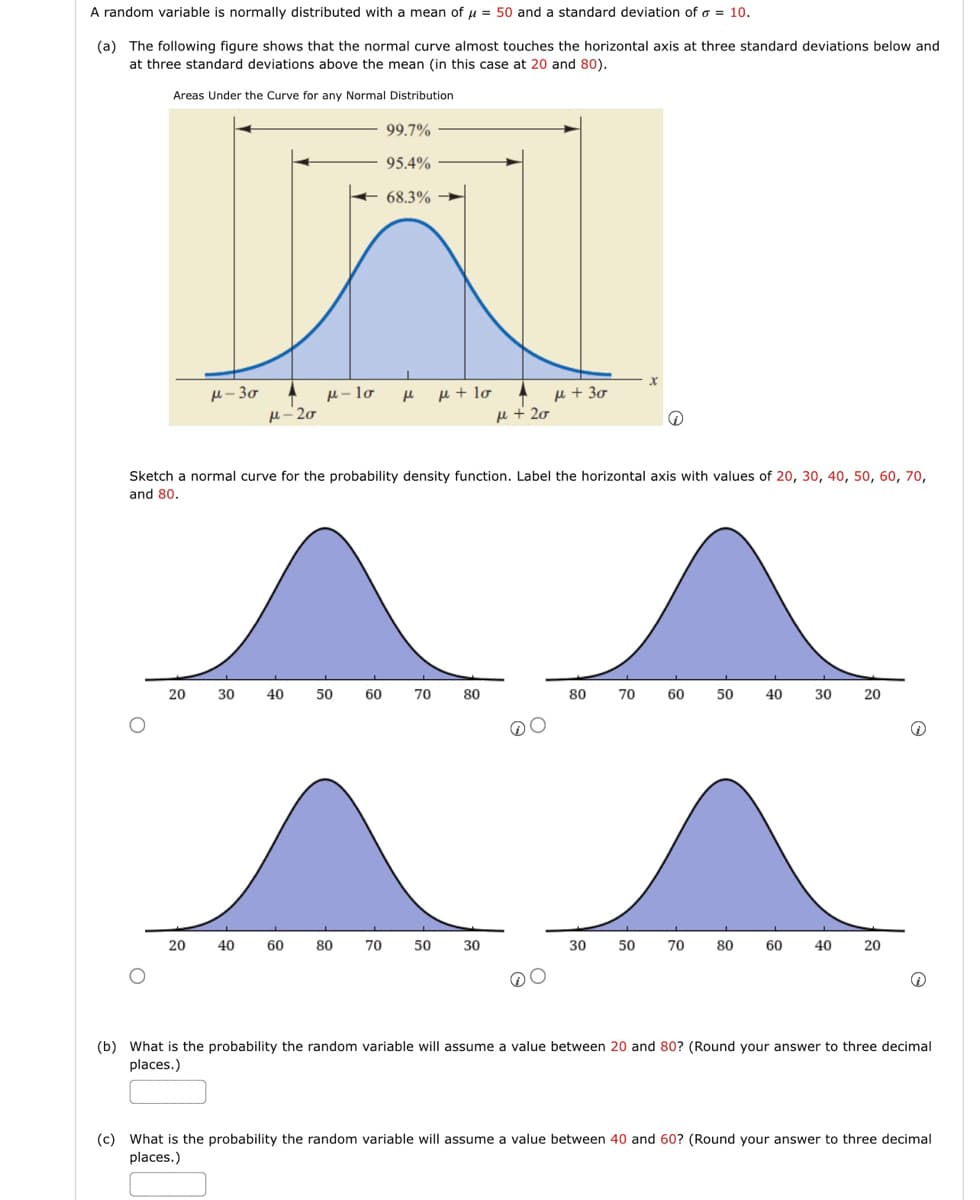
Transcribed Image Text:A random variable is normally distributed with a mean of μ = 50 and a standard deviation of a = 10.
(a) The following figure shows that the normal curve almost touches the horizontal axis at three standard deviations below and
at three standard deviations above the mean (in this case at 20 and 80).
Areas Under the Curve for any Normal Distribution
O
O
м-30
20
μ-20
30
40
20 40 60
Sketch a normal curve for the probability density function. Label the horizontal axis with values of 20, 30, 40, 50, 60, 70,
and 80.
99.7%
95.4%
μ-lo н
50
68.3%
60
μ + lo
70
80
A
T
μ + 20
80 70 50 30
+30
80
X
70
60
50
40 30 20
30 50 70 80 60 40
20
(b) What is the probability the random variable will assume a value between 20 and 80? (Round your answer to three decimal
places.)
(c) What is the probability the random variable will assume a value between 40 and 60? (Round your answer to three decimal
places.)
Expert Solution
This question has been solved!
Explore an expertly crafted, step-by-step solution for a thorough understanding of key concepts.

This is a popular solution!

Trending now
This is a popular solution!

Step by step
Solved in 5 steps with 1 images

Recommended textbooks for you
Algebra & Trigonometry with Analytic Geometry
Algebra
ISBN:
9781133382119
Author:
Swokowski
Publisher:
Cengage
Algebra & Trigonometry with Analytic Geometry
Algebra
ISBN:
9781133382119
Author:
Swokowski
Publisher:
Cengage