he accompanying table gives amounts of arsenic in samples of brown rice from three different states. The amounts are in micrograms of arsenic and all samples have the same serving size. The data are from the Food and Drug Administration. Use a 0.05 significance l st the claim that the three samples are from populations with the same mean. Do the amounts of arsenic appear to be different in the different states? Given that the amounts of arsenic in the samples from Texas have the highest mean, can we conclude that brown rice exas poses the greatest health problem? Click the icon to view the data. What are the hypotheses for this test? A. Ho: H₁ H₂ H3 H₁ H₁ H₂ H3 B. Ho: H₁ H₂ H3 H₁: At least one of the means is different from the others OC. Ho: At least one of the means is different from the others H₁ H₁ H₂ H3 OD. H₂: H₁ H₂ H3 H₁ H₁ H₂ H3 etermine the test statistic. he test statistic is Round to two decimal places as needed.) etermine the P-value. he P-value is Round to three decimal places as needed.) o the amounts of arsenic appear to be different in the different states? sufficient evidence at a 0.05 significance level to warrant rejection of the claim that the three different states have mean arsenic content(s) in brown rice. iven that the amounts of arsenic in the samples from Texas have the highest mean, can we conclude that brown rice from Texas poses the greatest health problem? here OA. The results from ANOVA allow us to conclude that Texas has the highest population mean, so we can conclude that brown rice from Texas poses the greatest health problem. OB. The results from ANOVA do not allow us to conclude that any one specific population mean is different from the others, so we cannot conclude that brown rice from Texas poses the greatest health problem. OC. Because the amounts of arsenic in the samples from Texas have the highest mean, we can conclude that brown rice from Texas poses the greatest health problem. D. Although the amounts of arsenic in the samples from Texas have the highest mean there may be other states that have a higher mean so we cannot conclude that brown rice from Texas noses the greatest health problem
he accompanying table gives amounts of arsenic in samples of brown rice from three different states. The amounts are in micrograms of arsenic and all samples have the same serving size. The data are from the Food and Drug Administration. Use a 0.05 significance l st the claim that the three samples are from populations with the same mean. Do the amounts of arsenic appear to be different in the different states? Given that the amounts of arsenic in the samples from Texas have the highest mean, can we conclude that brown rice exas poses the greatest health problem? Click the icon to view the data. What are the hypotheses for this test? A. Ho: H₁ H₂ H3 H₁ H₁ H₂ H3 B. Ho: H₁ H₂ H3 H₁: At least one of the means is different from the others OC. Ho: At least one of the means is different from the others H₁ H₁ H₂ H3 OD. H₂: H₁ H₂ H3 H₁ H₁ H₂ H3 etermine the test statistic. he test statistic is Round to two decimal places as needed.) etermine the P-value. he P-value is Round to three decimal places as needed.) o the amounts of arsenic appear to be different in the different states? sufficient evidence at a 0.05 significance level to warrant rejection of the claim that the three different states have mean arsenic content(s) in brown rice. iven that the amounts of arsenic in the samples from Texas have the highest mean, can we conclude that brown rice from Texas poses the greatest health problem? here OA. The results from ANOVA allow us to conclude that Texas has the highest population mean, so we can conclude that brown rice from Texas poses the greatest health problem. OB. The results from ANOVA do not allow us to conclude that any one specific population mean is different from the others, so we cannot conclude that brown rice from Texas poses the greatest health problem. OC. Because the amounts of arsenic in the samples from Texas have the highest mean, we can conclude that brown rice from Texas poses the greatest health problem. D. Although the amounts of arsenic in the samples from Texas have the highest mean there may be other states that have a higher mean so we cannot conclude that brown rice from Texas noses the greatest health problem

MATLAB: An Introduction with Applications
6th Edition
ISBN:9781119256830
Author:Amos Gilat
Publisher:Amos Gilat
Chapter1: Starting With Matlab
Section: Chapter Questions
Problem 1P

Related questions
Question
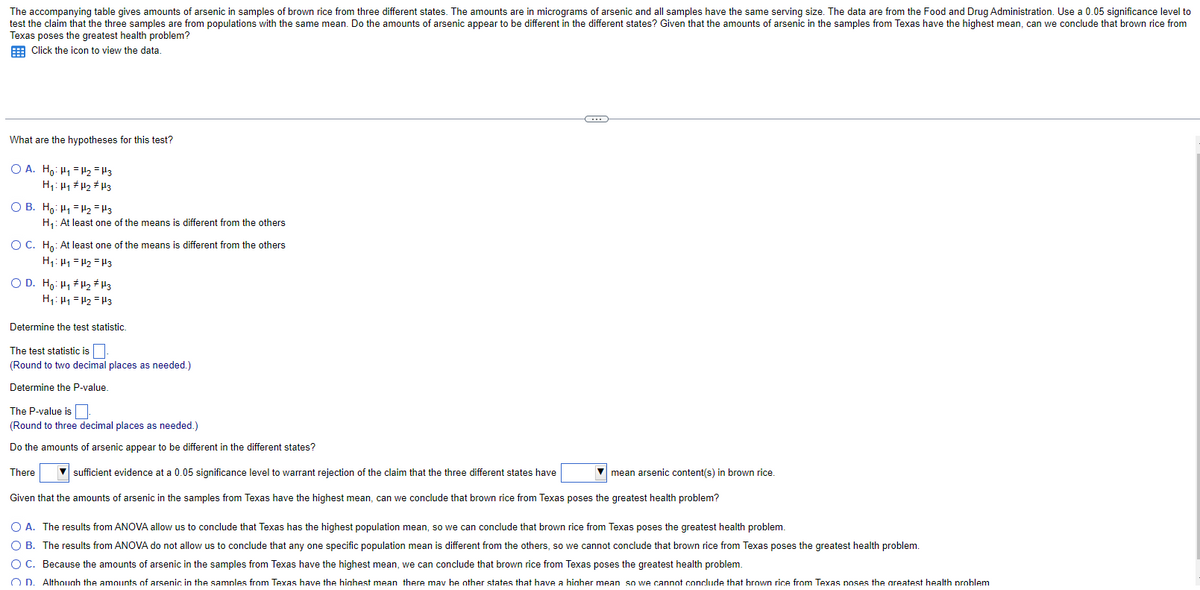
Transcribed Image Text:The accompanying table gives amounts of arsenic in samples of brown rice from three different states. The amounts are in micrograms of arsenic and all samples have the same serving size. The data are from the Food and Drug Administration. Use a 0.05 significance level to
test the claim that the three samples are from populations with the same mean. Do the amounts of arsenic appear to be different in the different states? Given that the amounts of arsenic in the samples from Texas have the highest mean, can we conclude that brown rice from
Texas poses the greatest health problem?
Click the icon to view the data.
What are the hypotheses for this test?
OA. Ho: H₁ H₂ H3
H₁ H₁ H₂ H3
OB. Ho: H₁ H₂ H3
H₁: At least one of the means is different from the others
O C. Ho: At least one of the means is different from the others
H₁: H₁
H₂ H3
OD. Ho: H₁ H₂ H3
H₁: H₁ H₂ H3
Determine the test statistic.
The test statistic is
(Round to two decimal places as needed.)
Determine the P-value.
The P-value is.
(Round to three decimal places as needed.)
Do the amounts of arsenic appear to be different in the different states?
There
C
sufficient evidence at a 0.05 significance level to warrant rejection of the claim that the three different states have
mean arsenic content(s) in brown rice.
Given that the amounts of arsenic in the samples from Texas have the highest mean, can we conclude that brown rice from Texas poses the greatest health problem?
O A. The results from ANOVA allow us to conclude that Texas has the highest population mean, so we can conclude that brown rice from Texas poses the greatest health problem.
O B. The results from ANOVA do not allow us to conclude that any one specific population mean is different from the others, so we cannot conclude that brown rice from Texas poses the greatest health problem.
O C. Because the amounts of arsenic in the samples from Texas have the highest mean, we can conclude that brown rice from Texas poses the greatest health problem.
OD. Although the amounts of arsenic in the samples from Texas have the highest mean there may be other states that have a higher mean so we cannot conclude that brown rice from Texas poses the greatest health problem
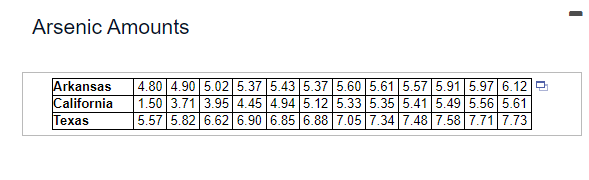
Transcribed Image Text:Arsenic Amounts
Arkansas 4.80 4.90 5.02 5.37 5.43 5.37 5.60 5.61 5.57 5.91 5.97 6.12
California 1.50 3.71 3.95| 4.45| 4.94| 5.12 5.33 5.35 5.41 5.49 5.56 5.61
Texas 5.57 5.82 6.62 6.90 6.85 6.88 | 7.05 7.34 7.48| 7.58 7.71 | 7.73
I
Expert Solution
This question has been solved!
Explore an expertly crafted, step-by-step solution for a thorough understanding of key concepts.

Step by step
Solved in 6 steps with 6 images

Recommended textbooks for you
MATLAB: An Introduction with Applications
Statistics
ISBN:
9781119256830
Author:
Amos Gilat
Publisher:
John Wiley & Sons Inc

Probability and Statistics for Engineering and th…
Statistics
ISBN:
9781305251809
Author:
Jay L. Devore
Publisher:
Cengage Learning

Statistics for The Behavioral Sciences (MindTap C…
Statistics
ISBN:
9781305504912
Author:
Frederick J Gravetter, Larry B. Wallnau
Publisher:
Cengage Learning
MATLAB: An Introduction with Applications
Statistics
ISBN:
9781119256830
Author:
Amos Gilat
Publisher:
John Wiley & Sons Inc
Probability and Statistics for Engineering and th…
Statistics
ISBN:
9781305251809
Author:
Jay L. Devore
Publisher:
Cengage Learning
Statistics for The Behavioral Sciences (MindTap C…
Statistics
ISBN:
9781305504912
Author:
Frederick J Gravetter, Larry B. Wallnau
Publisher:
Cengage Learning

Elementary Statistics: Picturing the World (7th E…
Statistics
ISBN:
9780134683416
Author:
Ron Larson, Betsy Farber
Publisher:
PEARSON

The Basic Practice of Statistics
Statistics
ISBN:
9781319042578
Author:
David S. Moore, William I. Notz, Michael A. Fligner
Publisher:
W. H. Freeman

Introduction to the Practice of Statistics
Statistics
ISBN:
9781319013387
Author:
David S. Moore, George P. McCabe, Bruce A. Craig
Publisher:
W. H. Freeman