Sketch the sampling distribution of xand calculate the probability that the sample mean will be greater than 193 mg/dl.
Q: Describe the shape of this sampling distribution.
A:
Q: In a normal distribution, the ___________ focuses on 50% of the cases instead of the highest and…
A: Out of all probability distributions, the normal distribution is very popular and widely used for…
Q: Suppose X has a Weibull distribution with B = 3 and 8 = 4000 . What is P(X > 4500)?
A:
Q: Find the sample size using the range rule of thumb to estimate a.
A: Given : Highest observation=155 bpm Lowest observation=35 bpm Margin of error=E=3 bpm Significance…
Q: The sampling distribution of the mean, with N=30, of a moderately negatively skewed distribution is:…
A: If the probability distribution, with N=n, of a moderately negatively skewed, then the shape of the…
Q: For what sampling distribution works for?
A: Concept of sampling distribution: Let a particular characteristic of a population is of interest…
Q: a sampling distribution can be regarded as approximately normal when which conditions are met? In…
A: A sampling distribution is a probability distribution of a statistic obtained from a larger number…
Q: Consider a normal distribution, what probability is P(Z>0.75)?
A:
Q: Describe about the Sampling Distribution of z.
A:
Q: As the sample size increases, the mean of the sampling distribution: a. gets larger b. stays the…
A: We know that the sample size means the number of units in the sample. We know that by the central…
Q: The central limit theorem says that the sampling distribution of the sample mean is approximately…
A:
Q: what is the 95th percentile in the t-distribution if the sample size is 25?
A: Given Information: n=25Type of distribution=t distributionTo calculate=95th percentile
Q: What is the mean of the sampling distribution? Find the standard error of the sampling distribution…
A:
Q: Calculate the mean and standard deviation of ˆp, and plot its sampling distribution I n = 100 I n =…
A: Introduction: Denote p̂ as the sample proportion of people who prefer Candidate B, and p be the…
Q: The more efficient the estimate, the more the sampling distribution
A: Basic: Point estimate is a single number calculated from a set of data, that is the best guess of…
Q: Find the mean and standard deviation of the sampling distribution of x
A: Given that sample size is n = 36 Mean = 71 And SD = 24
Q: Estimate the the sample variance
A: Given, n=6 α=1-0.80=0.20 The sample mean and than the sample variance is obtained as-…
Q: In general, the ______ sample size, the closer the shape of the distribution of sample means is to a…
A: In general, the ______ sample size, the closer the shape of the distribution of sample means is to a…
Q: Find the probability that mean of sample size 36 will be negative.
A:
Q: Formulate is it true? The sampling distribution of r = .8 becomes normal as N increases.
A: Central limit Theorem: If the sample size increases or the distribution of the population follows…
Q: A population has a mean of u = 30. If 3 points are added to each score, what is the mean for the new…
A: Given : Mean(μ)=30 and N=3
Q: Let X, Y ~ N(μ, σ2) be independent. Does X+Y and 2X have the sample distribution? Explain.
A: Result used If X and Y ~ N(μ, σ2) aX+bY~N(aμ+bμ, a2σ2+ b2σ2)
Q: Suppose that a variable of a population has a bell-shaped distribution. If you take a large simple…
A: From the given question,
Q: Use the Student's t distribution to find for a 0.90 confidenaon level when the sample is 7. (Round…
A: tc when 0.90 level of significance and 7 sample sizeby using statistical table of student t…
Q: determine the mean and standard deviation of sampling distribution using n=1200, p=0.499
A:
Q: For a normal distribution, find the z-score location that divides the distribution that separates…
A: From the given information, It has been given that, P (Z<z) = 0.40 Using the inverse probability…
Q: According to the central limit theorem, the sampling distribution of the mean will more closely…
A: The central limit states X¯ ~Nμ,σ2n approximtely This theorem states that if the…
Q: he 4 conditions necessary to assume the sampling distribution of sample proportions follows a Normal…
A: Sampling distribution follows Normal distribution if the assumption is met.
Q: Is the statement below true or false? The distribution of the sample mean, x, will be normally dist…
A: The distribution of the sample mean, x̄, will be normally distributed if the sample is obtained…
Q: b. Calculate the standard deviation of the sampling distribution of p. 10. 6.4.2 For this scenario,…
A: "Since you have posted a question with multiple subparts, we will solve the first 3 sub-parts for…
Q: DEFINE THE SAMPLING DISTRIBUTION OF THE SAMPLE MEAN FOR NORMAL POPULATION WHEN THE VARIANCE IS KNOWN…
A: Standard deviation is the measure of dispersion which used to measure the deviation of data from the…
Q: What are the degrees of freedom for Student's t distribution when the sample size is 24? d.f. =
A: According to the given information, we have Student's t distribution is used. Sample size, n = 24
Q: Decide if the statement is True or False. The shape of a sampling distribution of sample means will…
A:
Q: Estimate the indicated probability by using the normal distribution as an approximation to…
A:
Q: What is a sampling distribution? What do we know about the shape and characteristics of the…
A: Concept of sampling distribution of sample mean: Let a particular characteristic of a population is…
Q: What does a sampling distribution serves?
A:
Q: Suppose you have a distribution with a mean equal to 10, median equal to 20, and mode equal to 30.
A:
Q: After conducting a literacy test on inmates, the evaluator realizes that the test was much more…
A: Given that after conduting a litrecy test on inmates, the evaluator realises that the test was much…
Q: Make your own example of mean of a sampling distribution. Also, construct the sampling distribution.
A: Concept of sampling distribution of sample mean: Let a particular characteristic of a population is…
Q: Which is a negatively skewed distribution?
A:
Q: Make your own example of mean and variance of a sampling distribution. Also, construct the sampling…
A: Given that We have to Make own example of mean and variance of a sampling distribution. Also,…
Q: Given a non-normal population with a variance of 25 and mean of 13. If the size of a sample is n =…
A: Assume the variable of interest is X.
Q: . Suppose the proportion of American adults who work at home is 40%. For a random sample of 100…
A: Solution-: Given: n=100, P=0.40 (Population proportion) Let, p^- be the sample proportion
Q: What is Sampling Distribution of t?
A:
Q: One measure of skewness of a distribution is defined by q=
A: Given information: Given that the three quartiles of the data are Q1, Q2 and Q3.
Q: What happens to the t-distribution as the sample size increases?
A: As we know that the t-distribution is affected by the sample size. As sample size increases the…
Q: Nationwide, 60 percent of persons taking a certain professional certification exam pass. Consider,…
A:
Q: As the sample size n increases, the standard deviation of the sampling distribution decreases.
A: The standard error (SE) of a statistic is approximately the standard deviation of a statistical…
Q: Describe about the Sampling Distribution of t.
A: Sampling distribution is used to describe the sample statistic or any function of the sample, which…
Q: Estimate the parameter 'p' in the sampling from binonial
A:
Can you solve the question below?
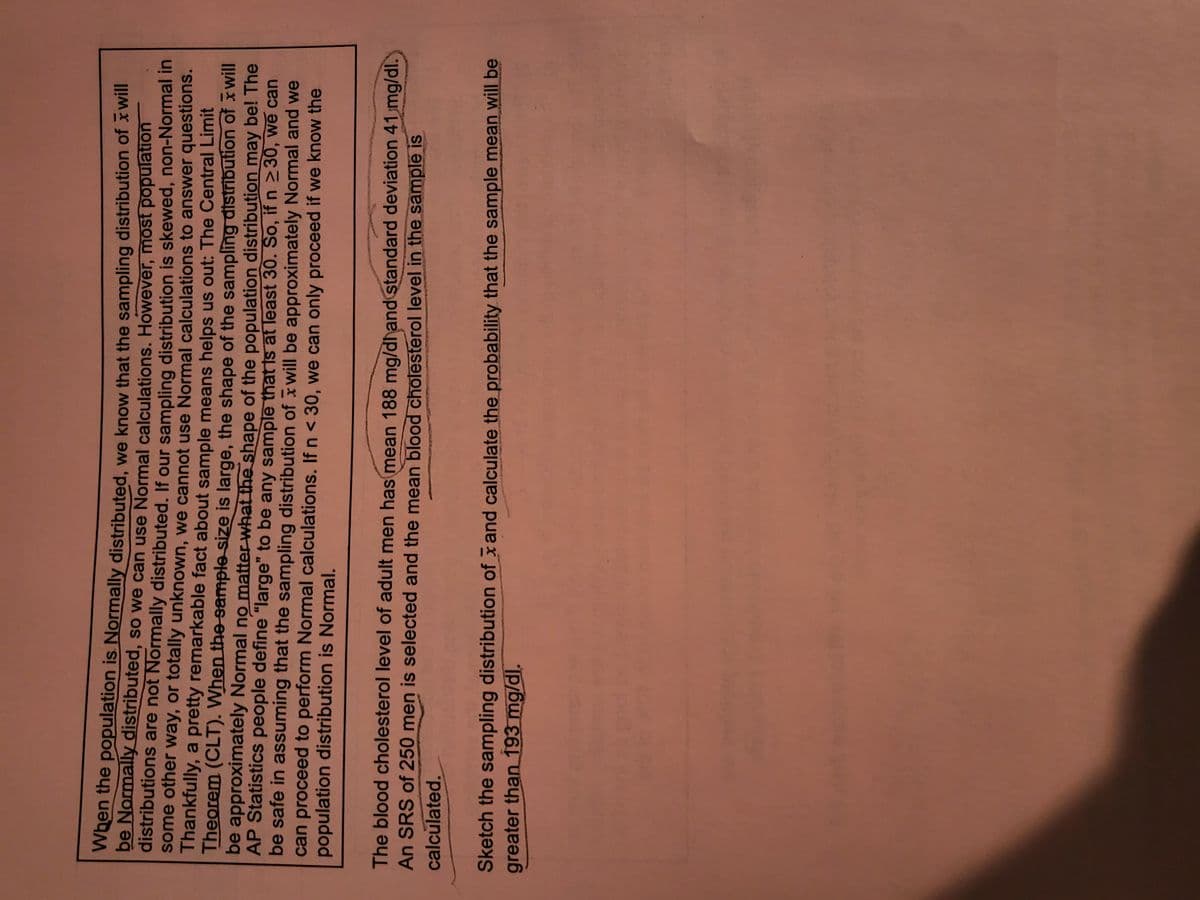
Trending now
This is a popular solution!
Step by step
Solved in 2 steps with 1 images
- A sample of 28 students will be normally distributed if taken from a normal population. TRUE OR FALSE According to the central limit theorem, the standard error for a sample mean becomes smaller as the sample size increases. TRUE OR FALSEIn the real world, what are some examples of data sources that, even with large sample sizes, will not trigger the central limit theorem?A simple random sample of size n =66, is obtained from a population that is skewed left with =33 and =3. . Does the population need to be normally distributed for the sampling distribution of x to be approximately normally distributed? Why? What is the sampling distribution of x? Does the population need to be normally distributed for the sampling distribution of x to be approximately normally distributed? Why?(A) Yes. The central limit theorem states that the sampling variability of nonnormal populations will increase as the sample size increases. (B) Yes. The central limit theorem states that only for underlying populations that are normal is the shape of the sampling distribution of x normal, regardless of the sample size, n. (C)No. The central limit theorem states that only if the shape of the underlying population is normal or uniform does the sampling distribution of x, become approximately normal as the sample size, n, increases. (D) No. The central limit theorem…
- The Central Limit Theorem is one of the most important and useful concepts of statistics. It forms a foundation for estimating population parameters and hypothesis testing and states that as the sample size increases, the sampling distribution of sample means approaches an FF distribution, regardless of the distribution of the original population. as the sample size increases, the sampling distribution of sample means approaches a Binomial distribution, regardless of the distribution of the original population. as the sample size increases, the sampling distribution of sample means approaches a Student (tt) distribution, regardless of the distribution of the original population. as the sample size increases, the sampling distribution of sample means approaches a Chi-square (χ2χ2) distribution, regardless of the distribution of the original population. as the sample size increases, the sampling distribution of sample means approaches a Normal (zz) distribution, regardless of the…What is the Central Limit Theorem? It is always true that as the sample size, n, increases, the distribution of the sample means will be approximately normally distributed. ExplainIf we have a sample of size 100 from a population of rope with sample mean breaking strength of 1040 pounds with standard deviation 200 pounds and we wish to run a hypothesis test with this data to see if the population mean breaking strength exceeds 1000 pounds, what is our ALTERNATE HYPOTHESIS?
- The actual proportion of families in a certain city who own their home is 0.68. If 84 families in this city are interviewed at random and their responses to the question of whether they own their home are looked upon as values of independent random variables having identical Bernoulli distributions with parameter θ = 0.68, with what approximate probability can we assert that the value we obtain for the sample proportion will fall between 0.65 and 0.70, based on the central limit theorem?A simple random sample of size n= 40 is obtained from a population with μ= 50 and σ= 4. Does the population need to be normally distributed for the sampling distribution of x-bar to be approximately normally distributed? Why? What is the sampling distribution of x-bar?The central limit theorem states that as sample size increases, the sampling distribution of the mean becomes-- more normally distributed more normally distributed less normally distributed but more leptokurtic less normally distributed but more leptokurtic more shaped like the population distribution more shaped like the population distribution smaller than the population mean
- A simple random sample of size n=10 is obtained from a population that is normally distributed with a mean of 40 and a standard deviation of 3. Is the sampling distribution normally distributed? Why? Yes, the sampling distribution is normally distributed because the population is normally distributed. Yes, the sampling distribution is normally distributed because the population mean is greater than 30. No, the sampling distribution is not normally distributed because the population is not normally distributed. No, the sampling distribution is not normally distributed because the sample size is less than 30.Texas Instruments produces computer chips in production runs of 1 million at a time. It has found that the fraction of defective modules can be very different in different production runs. These differences are caused by small variations in the set-up of each production run. Managers have observed that defective rates are roughly triangular, with a lower bound of 0%, and an upper bound of 50%. Defects more likely to be near 10% than any other single value in their range. (a) Before we test any modules, let’s understand the distribution of de- fects. Simulate at least 2,000 draws from the triangular distribution and answer the following questions. 1 What is the probability of a defect rate less than 0.25 in this production run? 2 For what number M would you say that the defective rate is equally likely to be above or below M? 3 What is the probability that we will find exactly two defective modules when we test 10 modules from this production run? (b) Now suppose that we have taken a…A sample of size n = 144 is drawn from a skewed infinite population with mean µ = 30 and standard deviation σ = 20 Find P(x̄ ≥ 34) Why is the sampling distribution of the sample mean x̄ approximately normally distributed for this problem?